


NRPLUS MEMBER ARTICLE A recession has been widely expected but has yet to arrive. The economy seems wavering on the brink, with March data at recessionary levels while April data were strong. Ambiguous signals characterize economic turning points. Payroll numbers remain strong but must be discounted, since every post-World War II recession arrived with payroll expansion, in most cases exceeding the current rate. Broad GDP growth continues too, albeit at an anemic 1.6 percent.
One clearly recessionary major economic statistic is Gross Domestic Income (GDI), the total of all income earned in an economy. U.S. GDI growth is currently at a level seen only in recessions, as illustrated in the following chart.
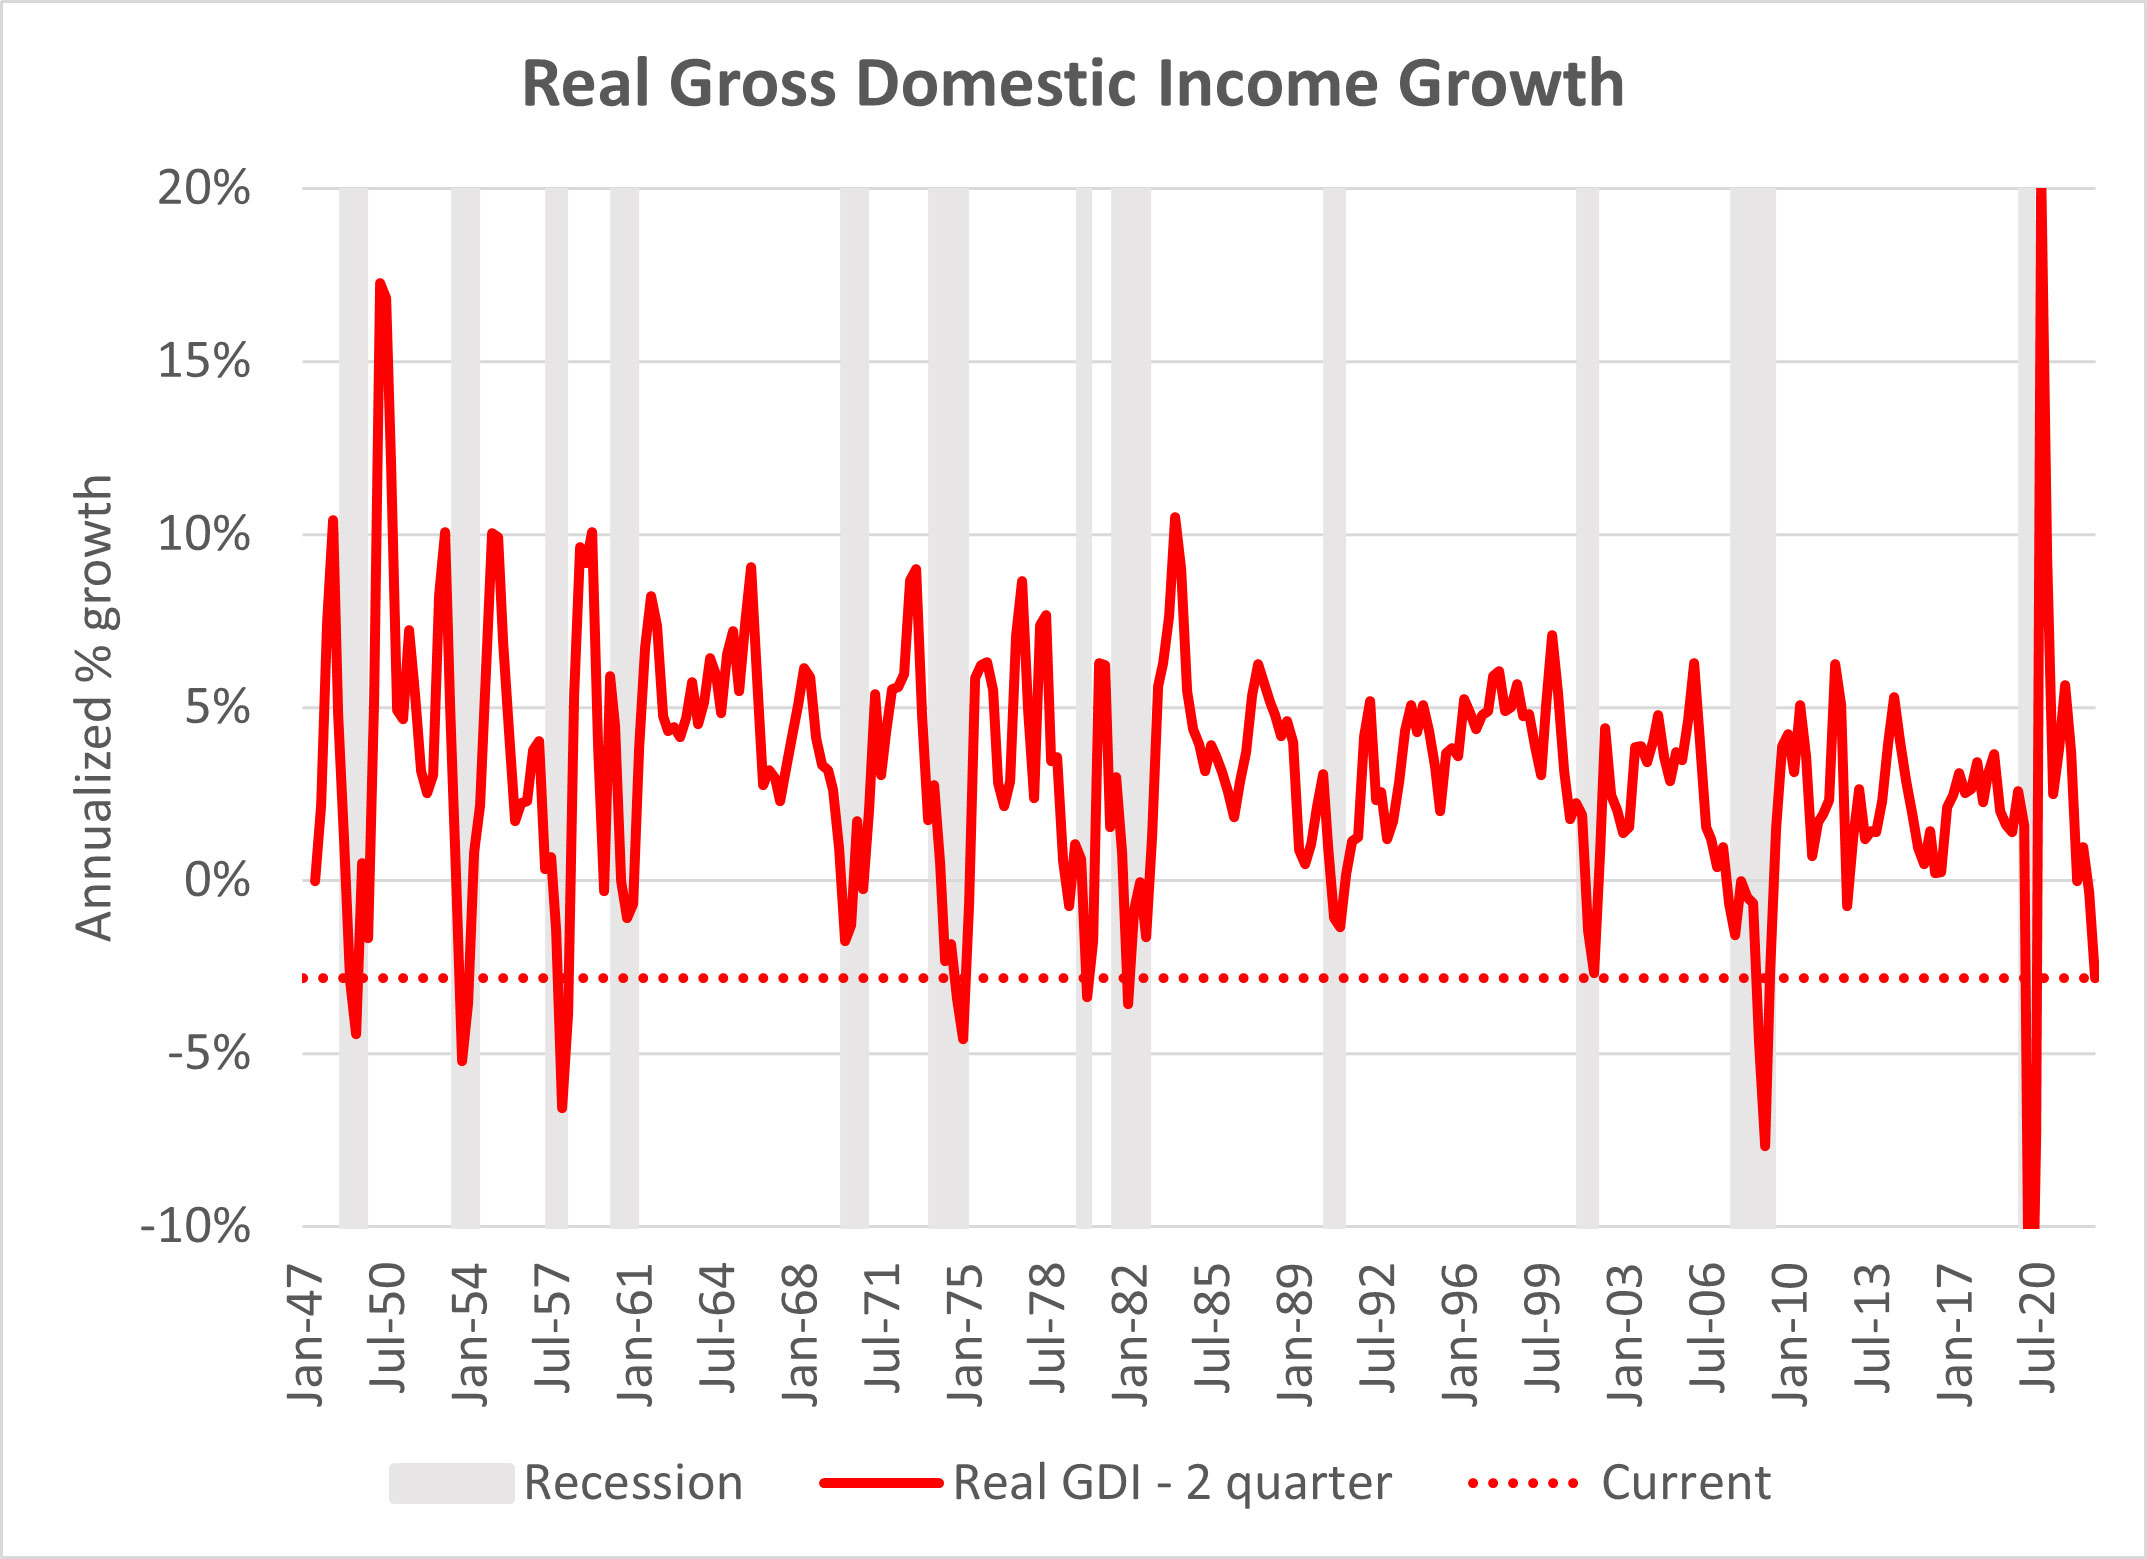
The GDI downturn comes primarily in private-enterprise income, which has declined at an annualized 11.4 percent rate over the last two quarters, belying rosy reported first-quarter earnings. Compensation has fallen too, at a 0.6 percent rate, which may explain some of the discontent registered in political polls.
Economic-national-accounting theory assumes income in an economy equals the value of output, which, in turn, equals expenditures by consumers, businesses, and government. In a large, complex economy such as the U.S.’s, though, with data from entirely different sources, there often is a “statistical discrepancy” between measures for income, output, and expenditures. Currently, this difference between GDP growth and GDI decline also is recessionary at historical highs, as shown in the chart below.
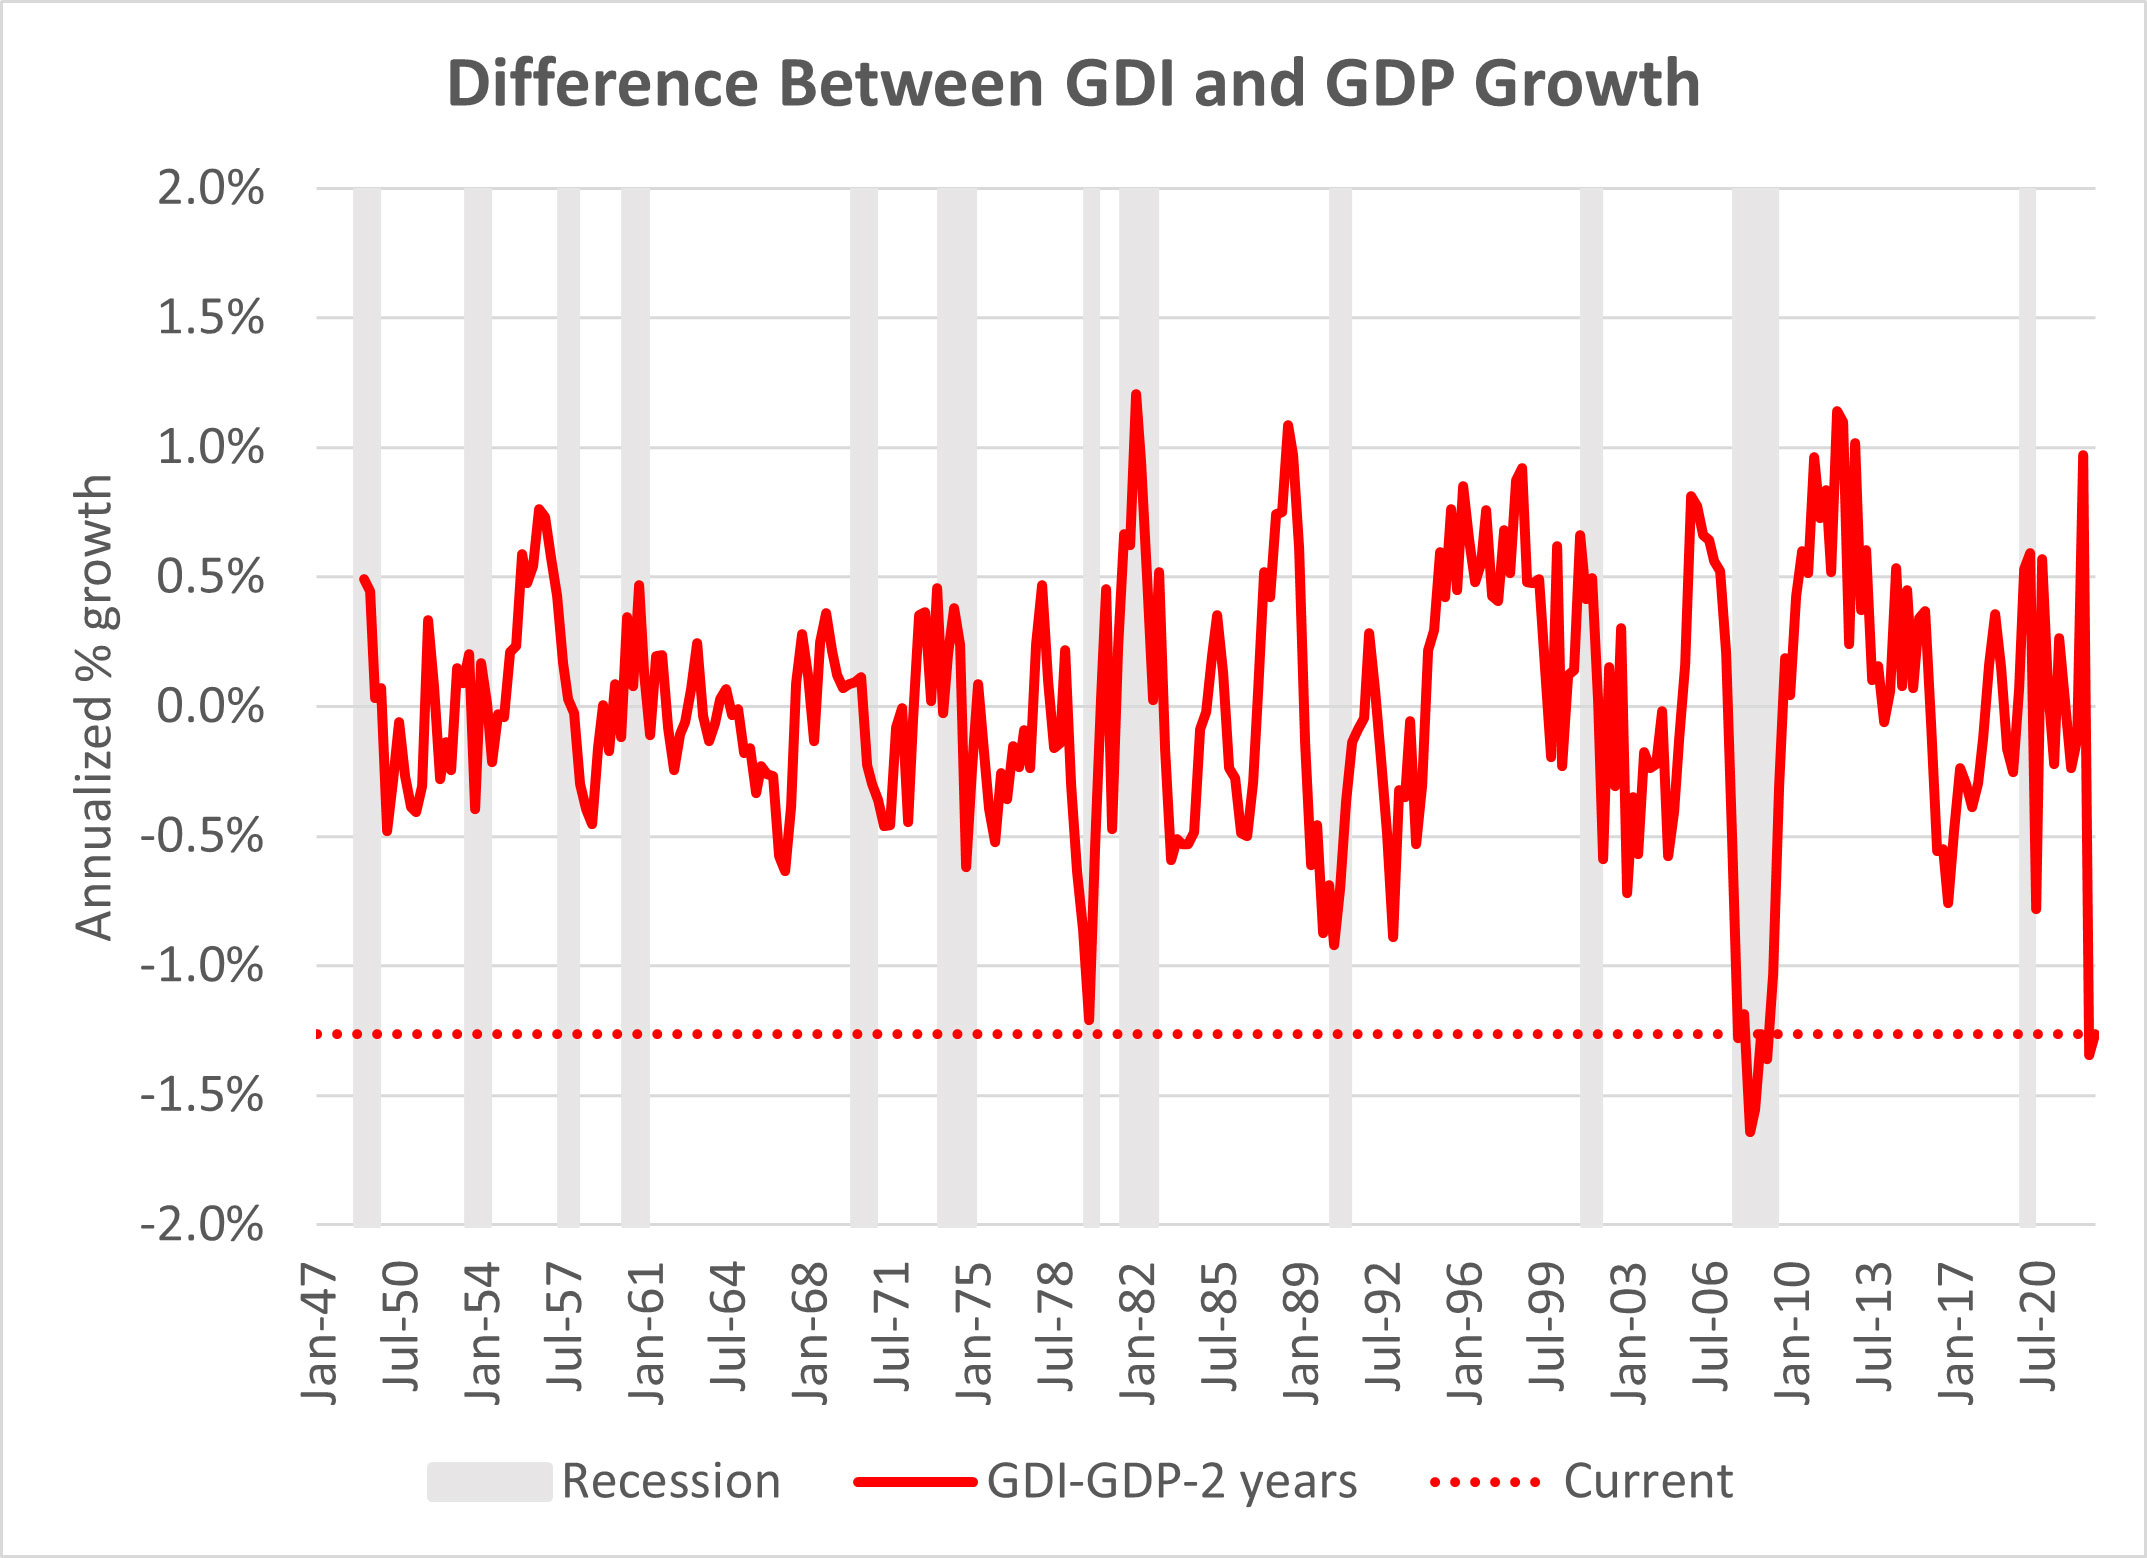
Only the brutal early 1980s and the recessions of the Great Financial Crisis (GFC) have been preceded by negative GDI–GDP discrepancies akin to today’s figure.
The GFC period bears comparison with today due to its recency and severity. The chart below overlays today’s GDI–GDP growth discrepancy against the same statistic back then.
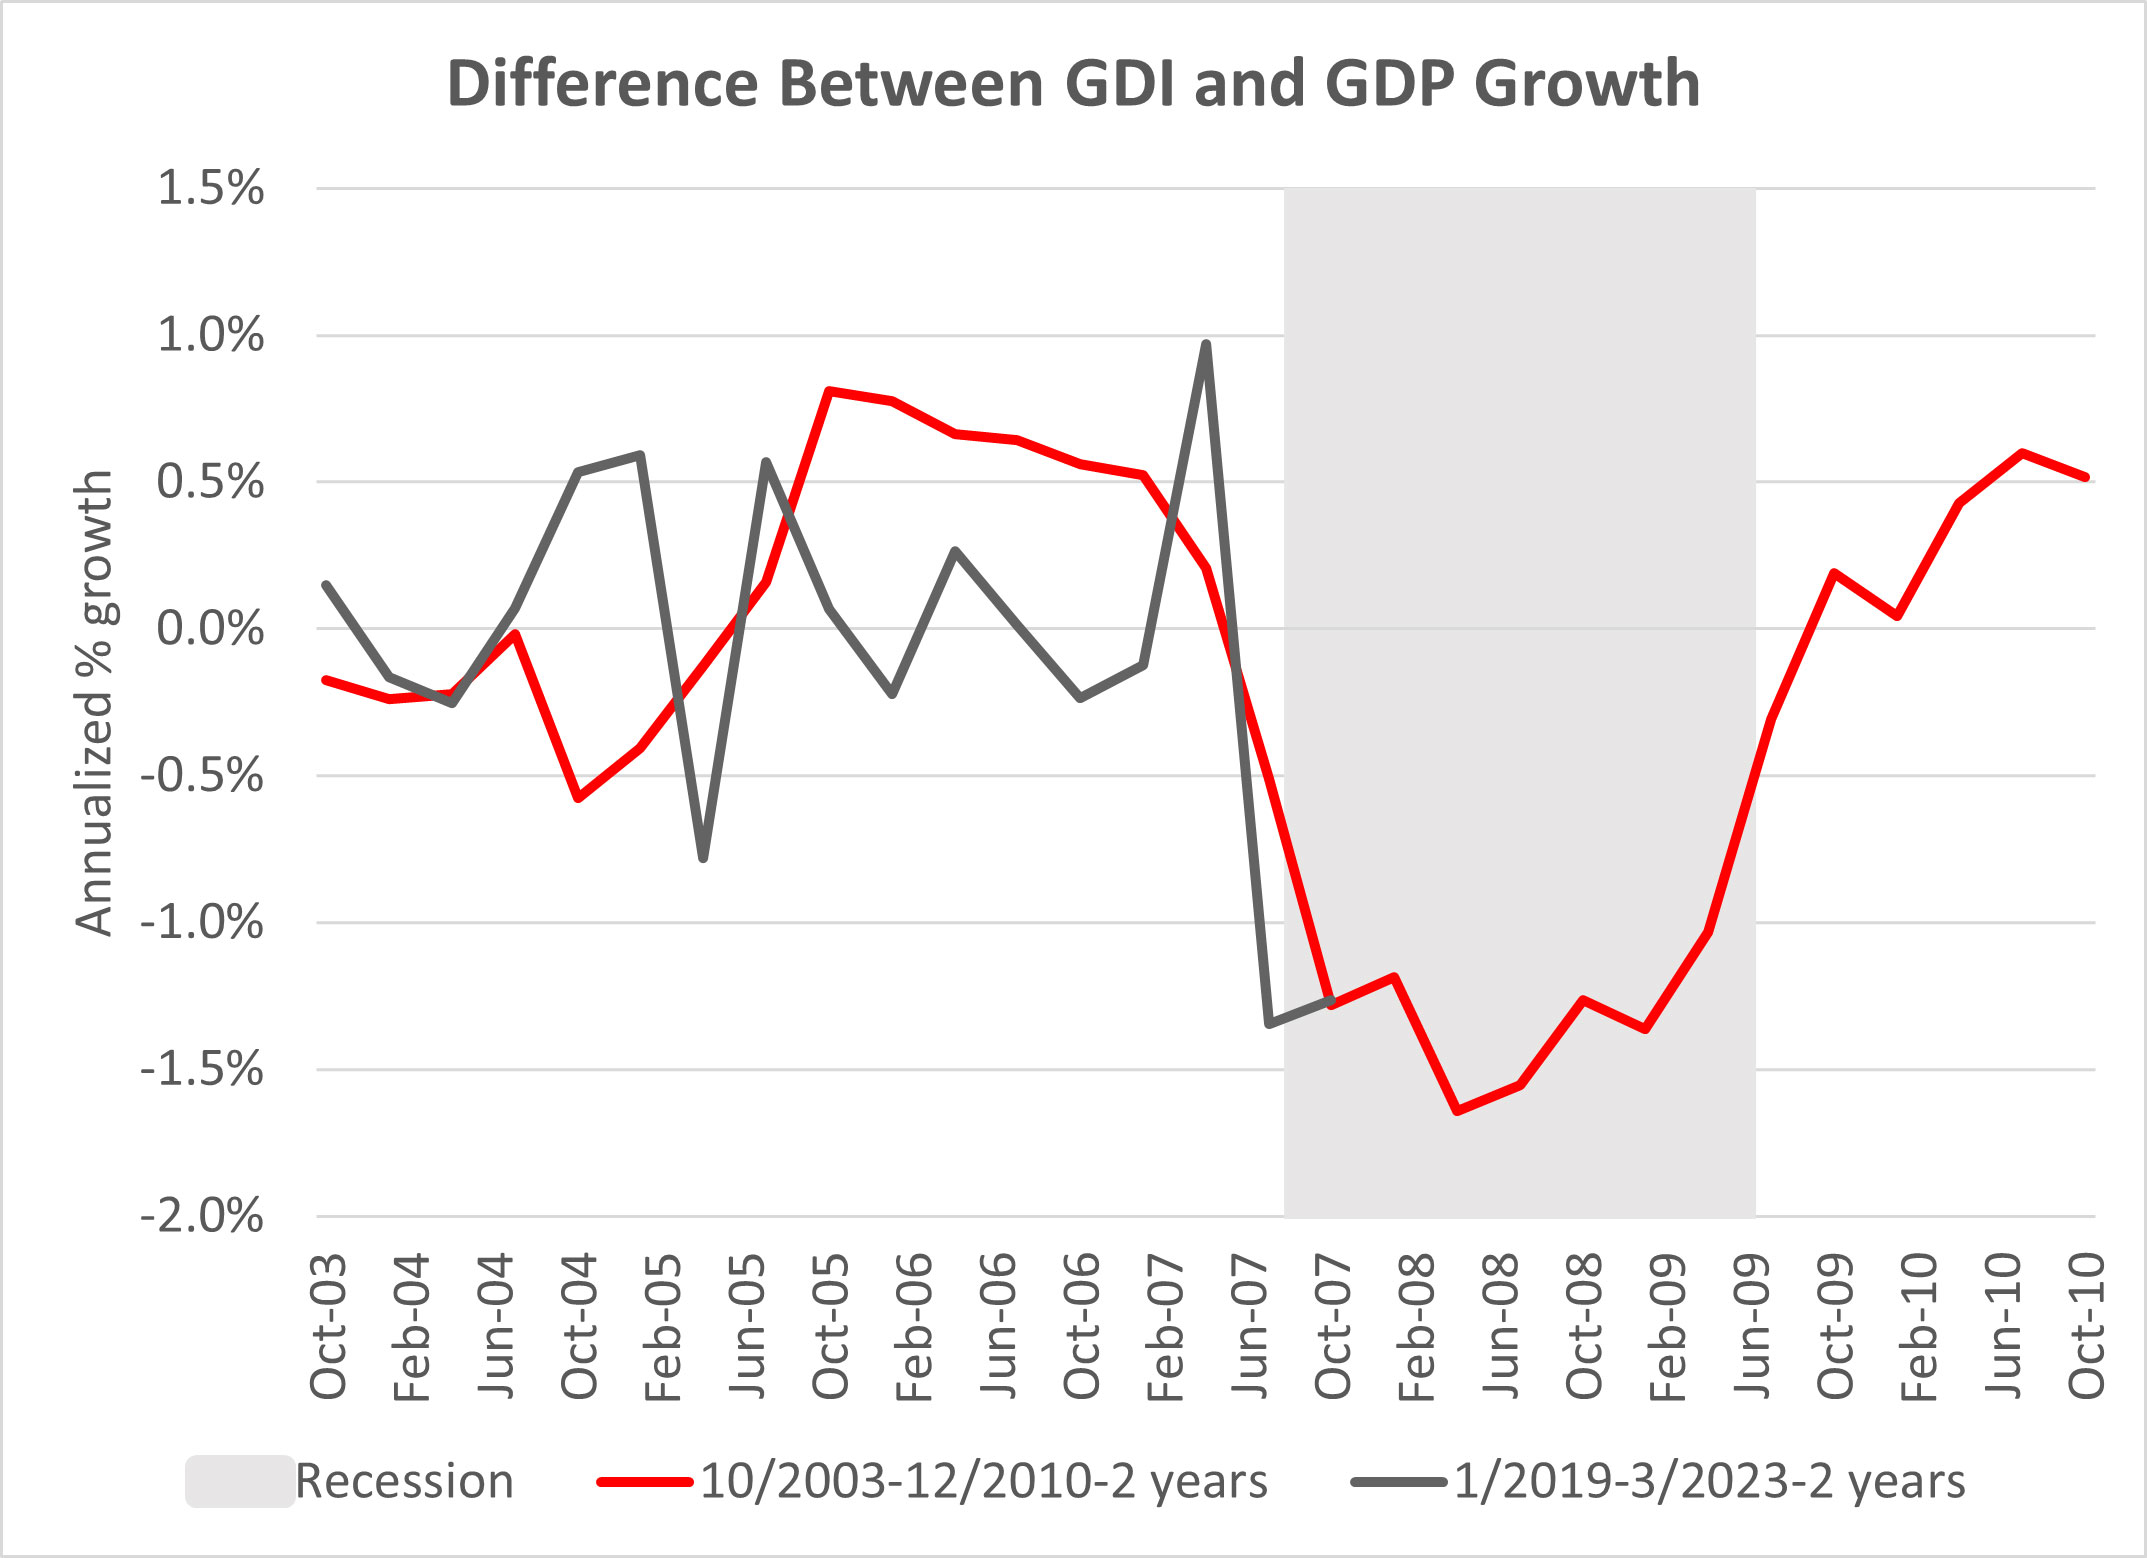
Both periods saw GDI running ahead of GDP by 0.5–1 percent, followed by a 1.3 percent plunge in GDI growth relative to GDP. During the GFC, a wrenching recession ensued. At the time, it was hoped the sector weakness in subprime mortgages wouldn’t spread more widely. Now, it is hoped that the weakness in Western U.S. real estate and in commercial real estate doesn’t spread more widely.
The chart above depicts good times, with robust income running ahead of consumption before the GFC downturn. Later, as income trails output, it is common to try keeping good times rolling. So, how does an economy maintain consumption amid declining income? The timeless answers are through borrowing and living off assets.
The GDI–GDP statistical discrepancy is significantly correlated with growth of bank assets, as shown below.
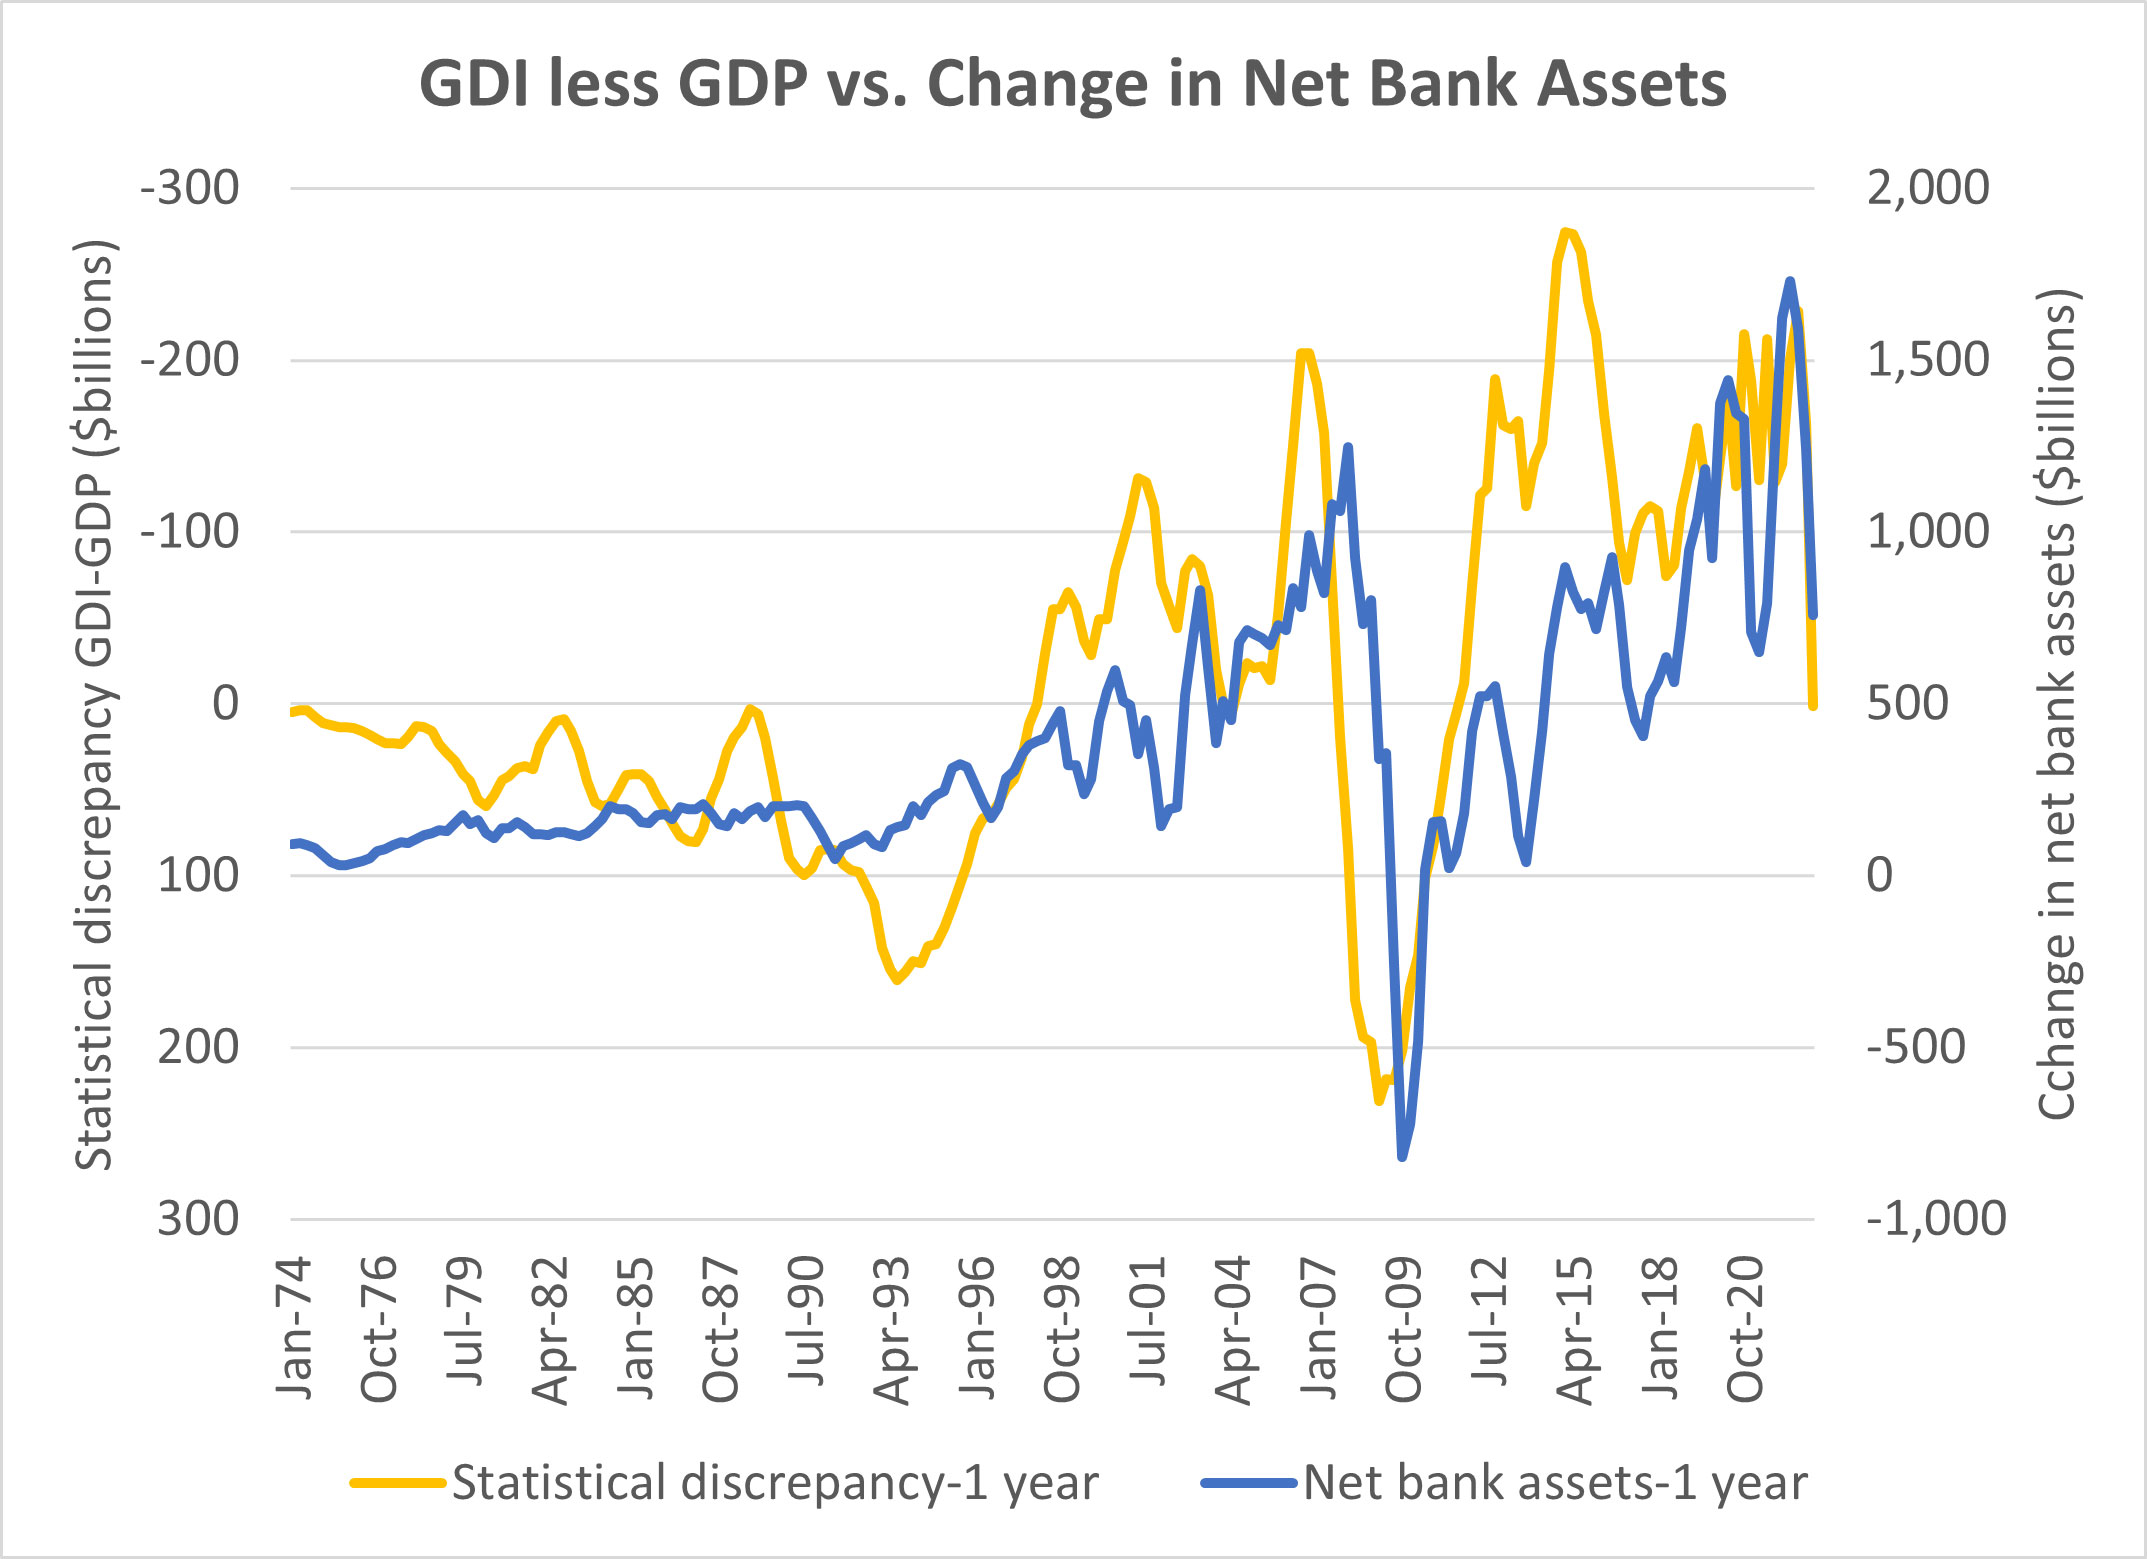
When consumption runs ahead of income, banks are expanding credit, while credit is restrained when income outpaces consumption.
As for drawing upon assets, homes are the most valuable asset for most Americans. The following chart compares the GDI–GDP statistical discrepancy to home-price changes.
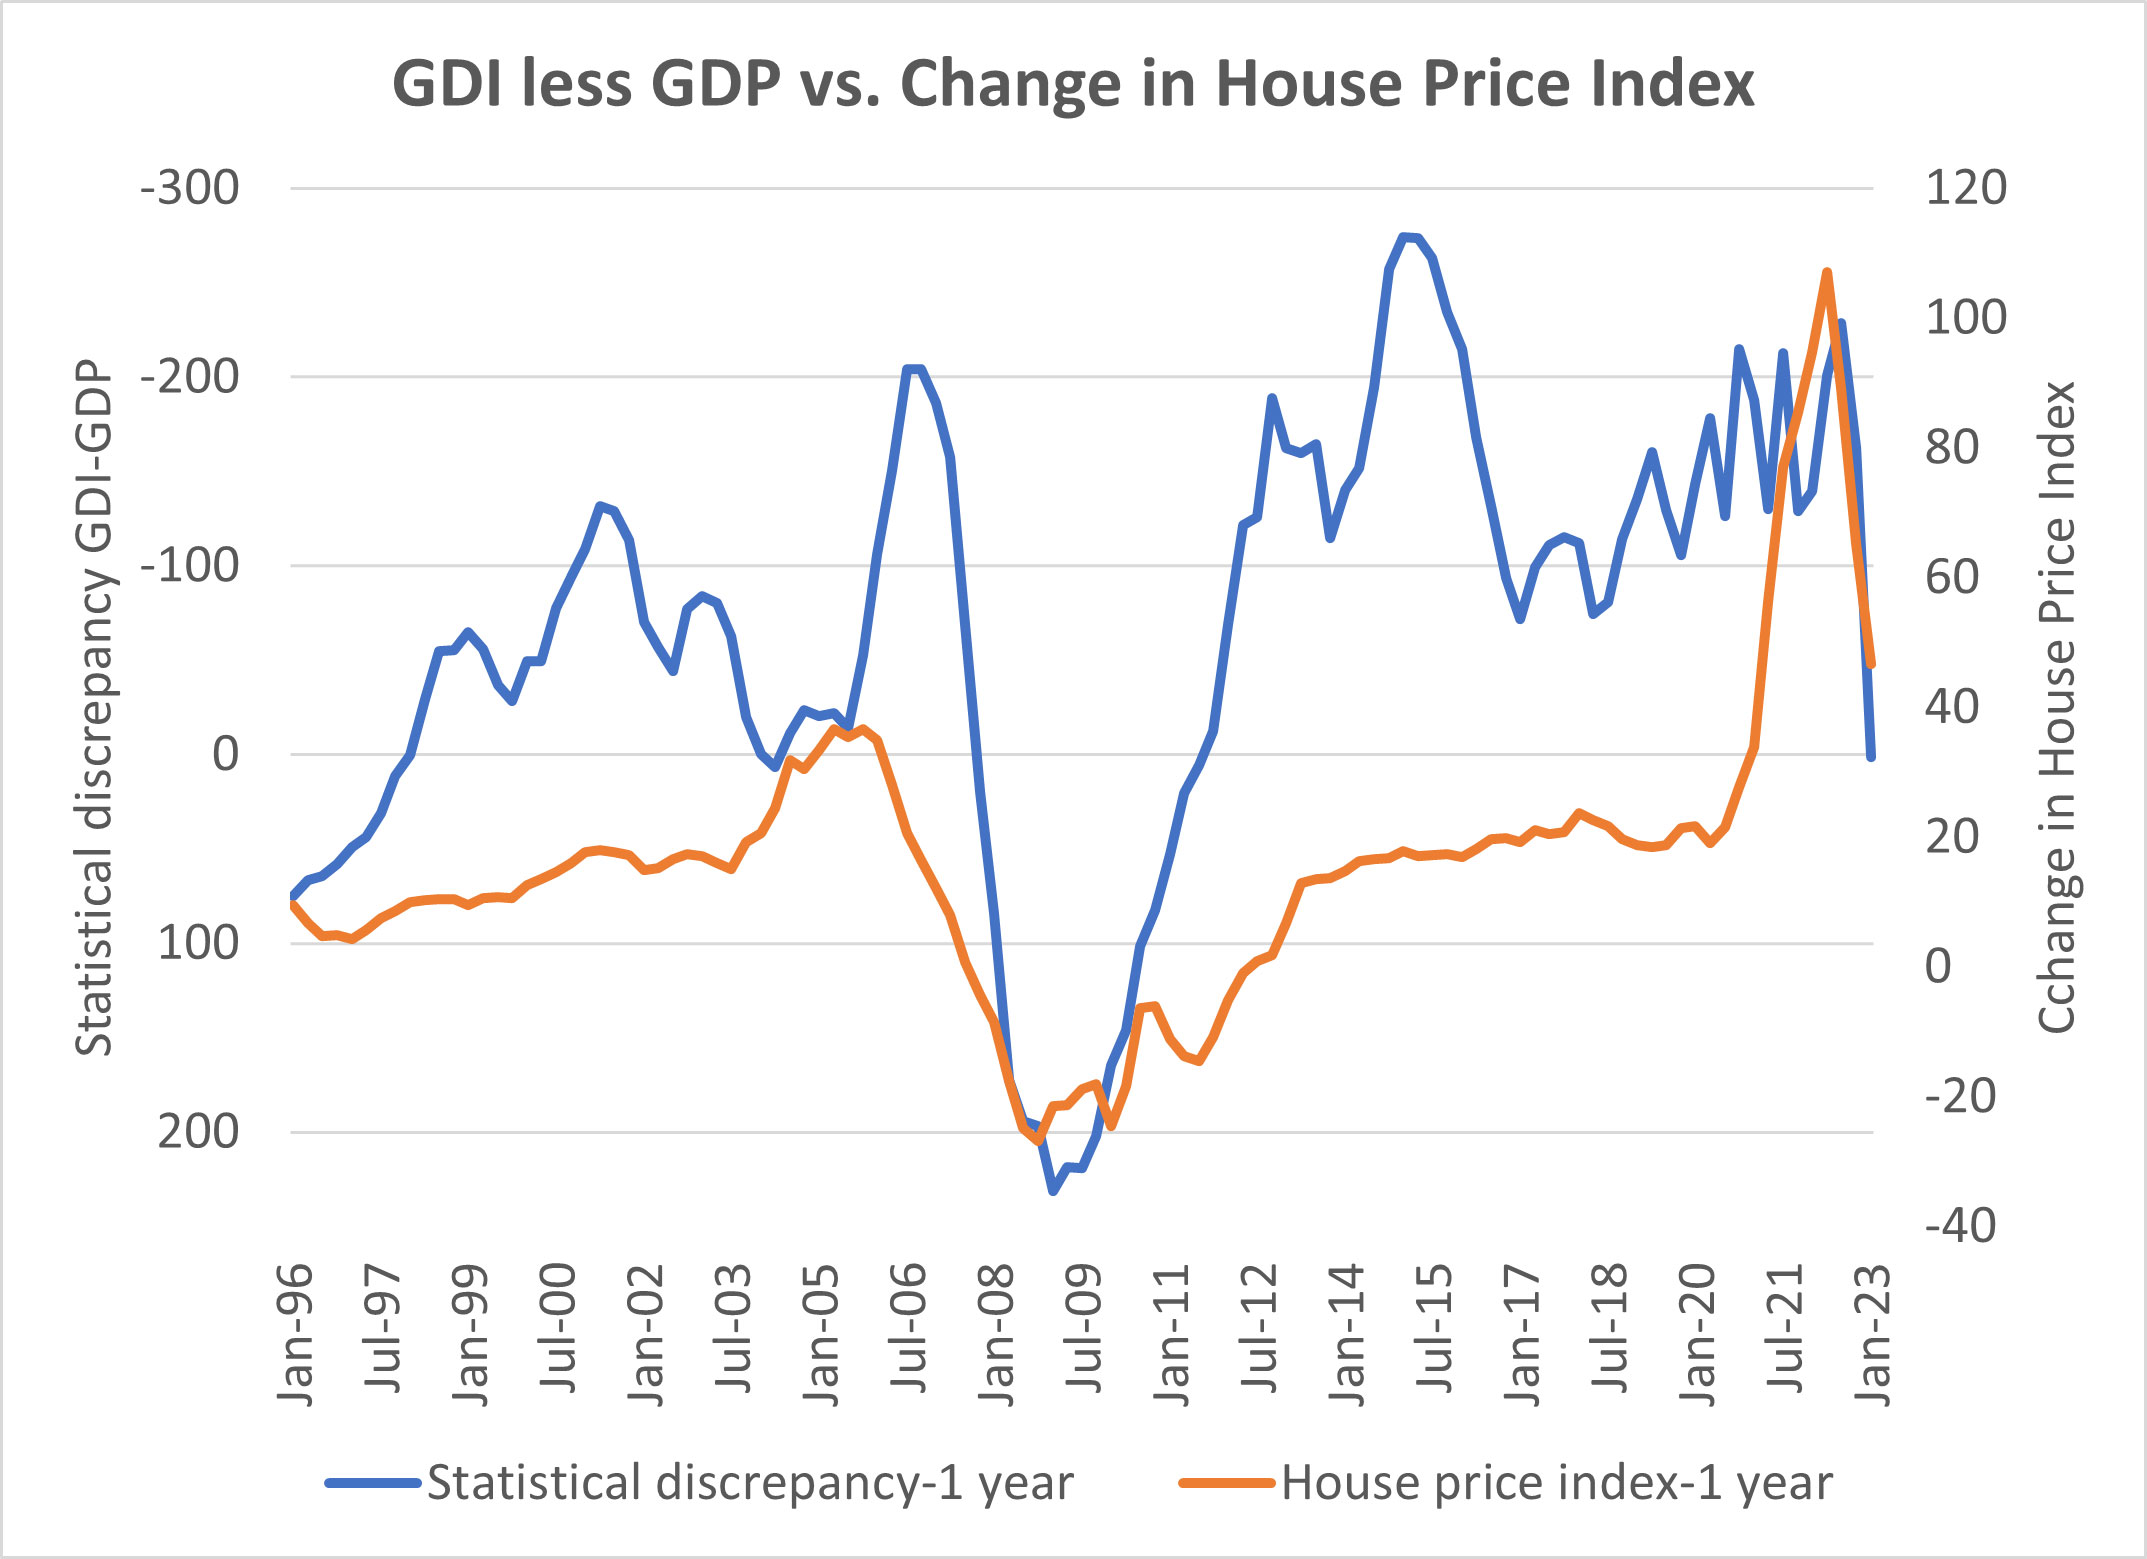
When home prices soar, consumers spend some of the rising values, whereas when prices drop, owners tighten their belts, with income rising above consumption.
Homeowners capitalize upon rising values indirectly through borrowing or directly through asset sales, which are reflected in capital gains on tax returns. The following chart compares the GDI–GDP statistical discrepancy to reported capital gains.
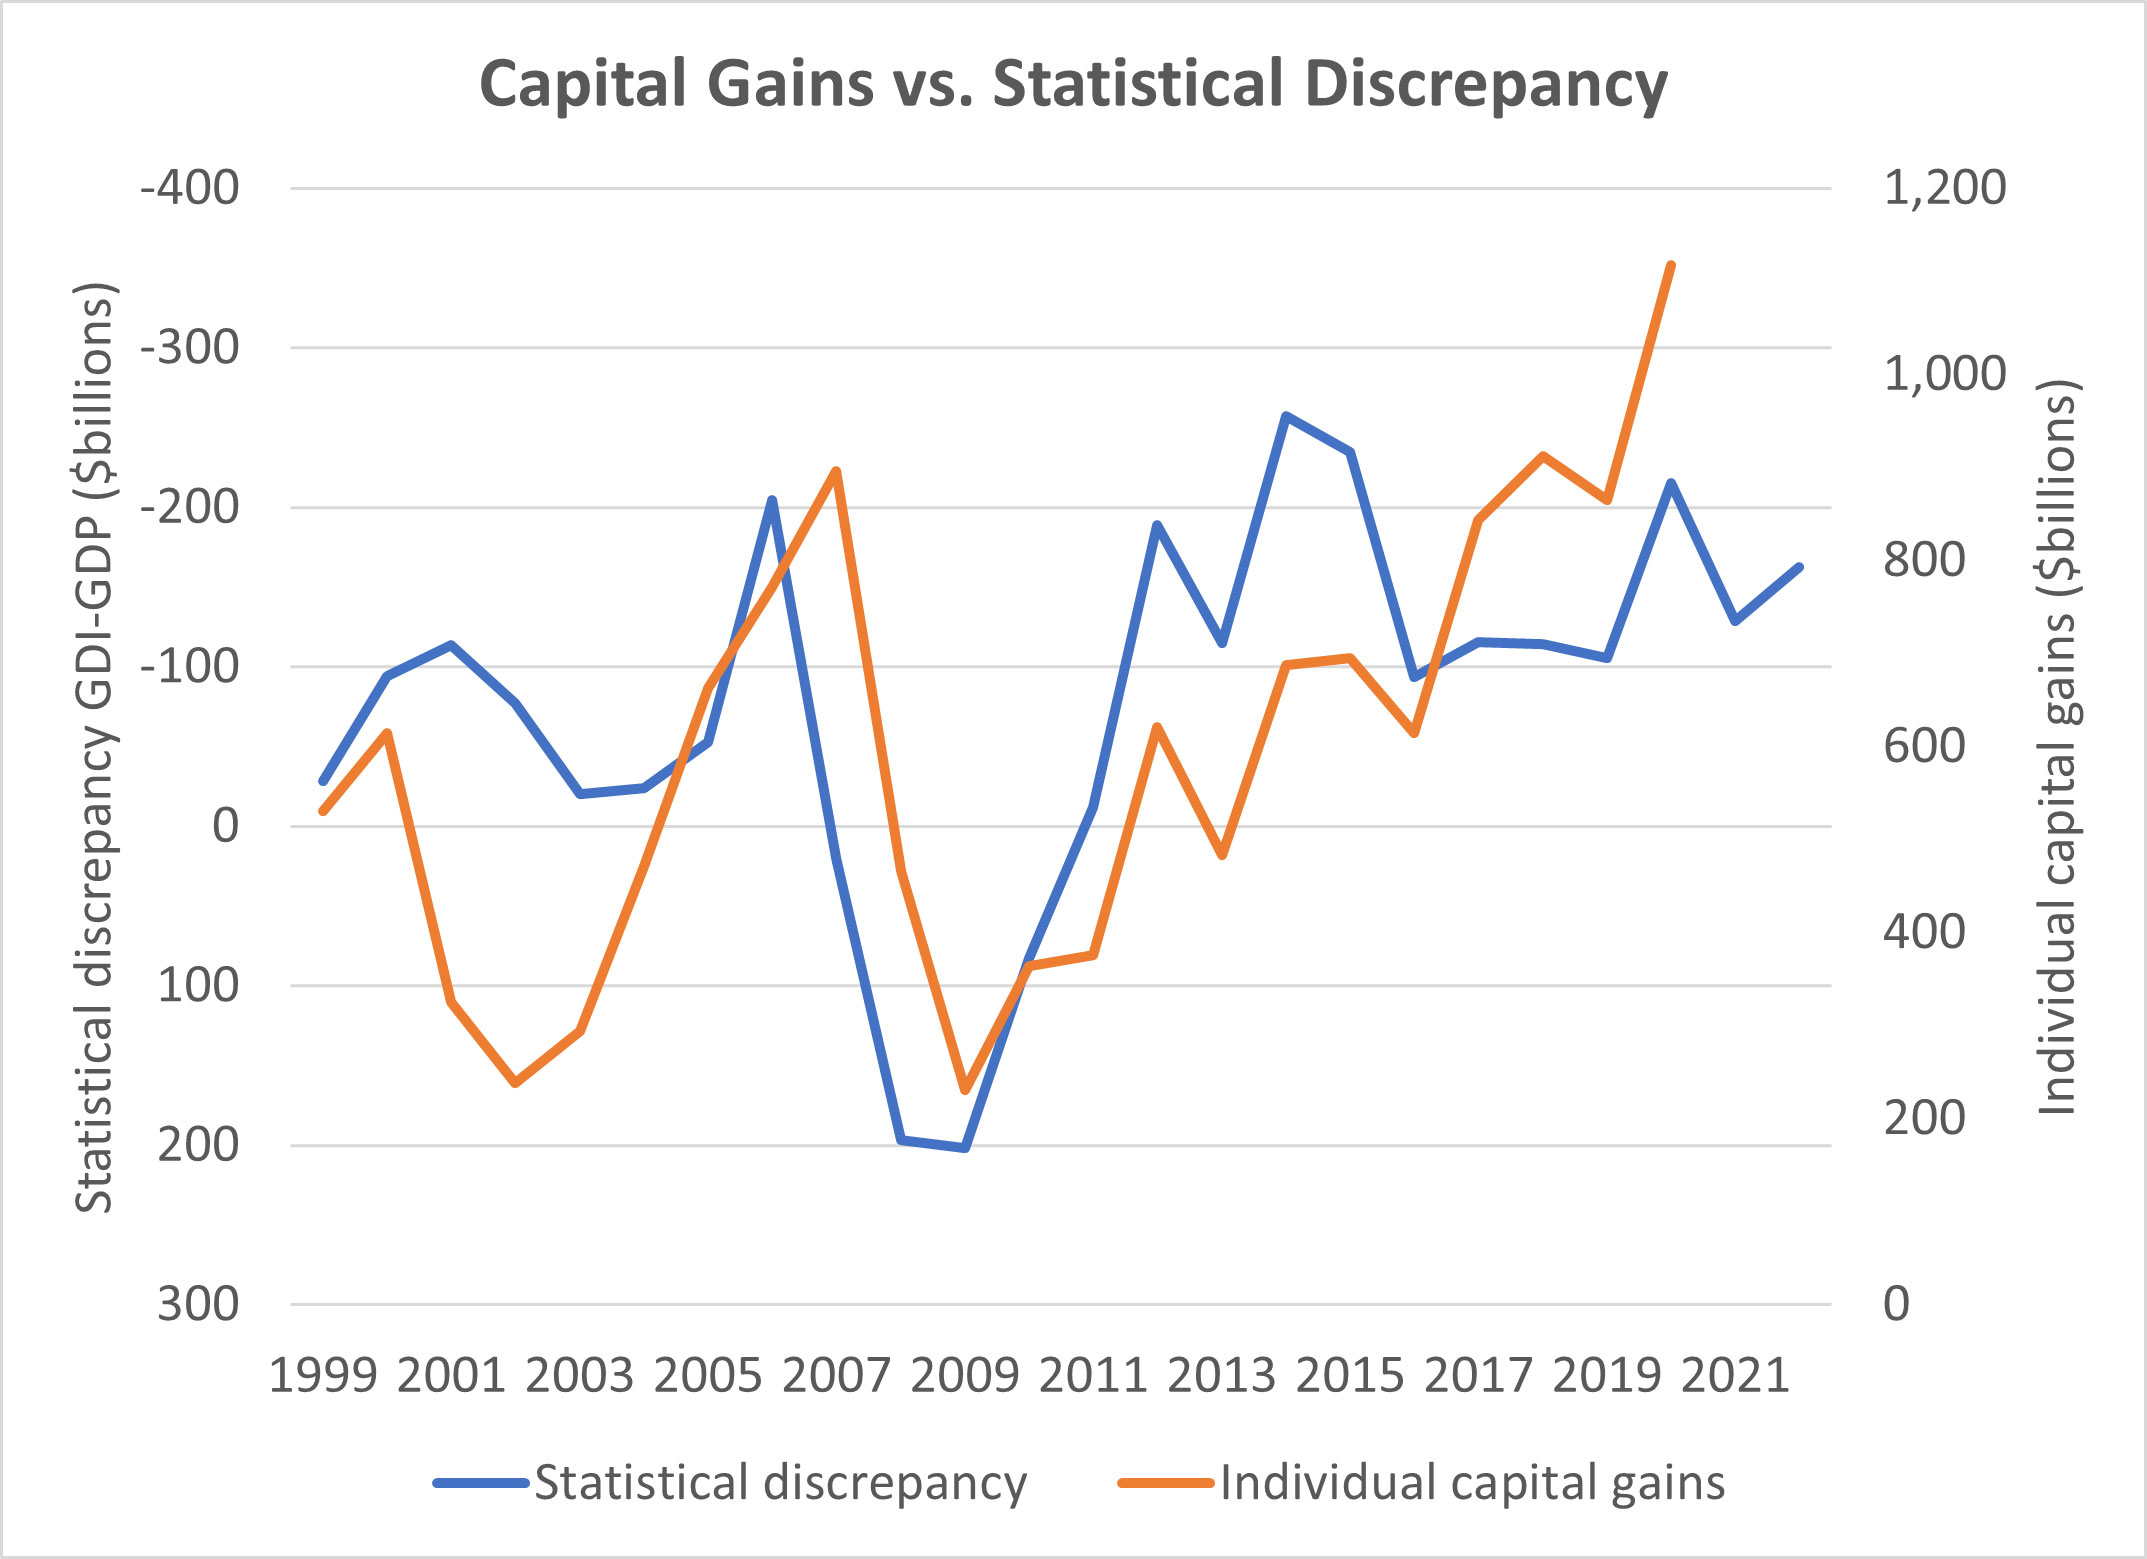
When assets are rich with high capital gains, consumption races ahead of income, whereas poor asset values force consumers to husband their income.
Any period of spending in excess of income must end one way or another, either with less spending or more income. While there is no precedent for reconciliation of the current level of discrepancy without a recession, we can still hope that it does not go as the Hemingway character’s bankruptcy, “Gradually, then suddenly.”