


Amid robust consumer demand and U.S. economic resilience, only a fraction of America’s largest companies have negative earnings this year.
In 2024, S&P 500 firms are forecast to see 9.5% annual earnings growth, exceeding their 10-year average of 8%. Overall, corporate profits have surged by nearly 70% since 2020, led by big tech companies investing in AI technologies. But looking beyond corporate giants, profitability is not as widespread given the riskier nature of small and mid-cap companies.
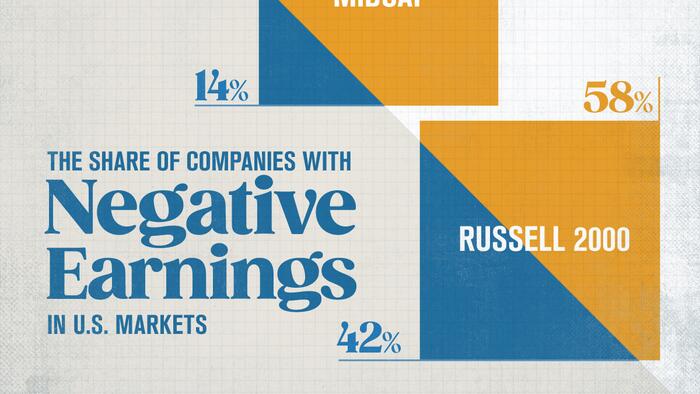
This graphic, via Visual Capitalist's Dorothy Neufeld, shows the share of companies with negative earnings in U.S. markets, based on data from Apollo.
While the vast majority of S&P 500 companies are seeing positive earnings in 2024, earnings growth is being propelled by a handful of technology giants.
In 2024, the Magnificent Seven is projected to drive 62% of earnings growth across the index, with Nvidia making up 13% of the total. Over the next few years, this trend is projected to continue, although at a slower pace amid increasing competition from new players and higher infrastructure costs.

For mid-cap companies, seen in the Russell Midcap Index, the share of companies with negative earnings stands at 14%, given their higher debt loads.
Over the last decade, mid-cap stocks have lagged behind large-caps, largely due to the outperformance of big tech. However, earnings growth across mid-cap stocks has typically risen at a faster pace since many are developing breakthrough technologies.
Additionally, monetary easing and Trump’s proposed corporate tax cuts could have an outsized effect on small and mid-cap companies due to lower borrowing costs.
While small-cap stocks have been on an impressive run this year, the share of unprofitable companies is considerably high, at 42% of firms in the Russell 2000—up from 14% two decades ago. Like mid-cap stocks, they have underperformed large-caps since 2014, but increasing investor risk appetite may drive an upswing looking ahead.
To learn more about this topic from a performance perspective, check out this graphic on the growth of $10,000 across major U.S. indices.