


America loves to tally its billionaires and track the S&P’s every tick, but the millions struggling to cover rent or stock the fridge rarely make the headline scroll.
Poverty is the country’s most persistent invisibility cloak, present in every zip code, yet ignored in a culture that equates success with worth.
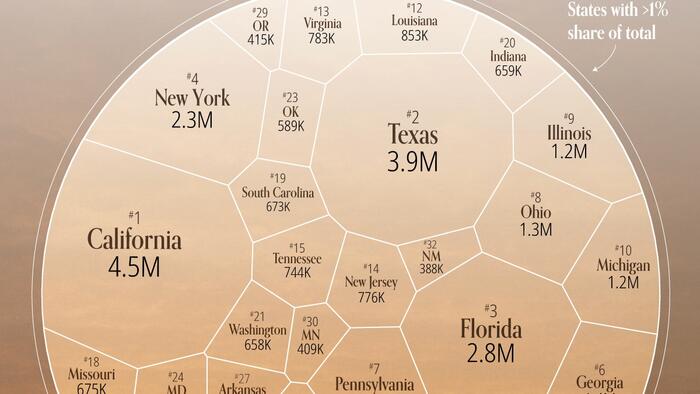
In this chart Visual Capitalist's Pallavi Rao breaks down where the poor in America actually live, ranked by each state.
Data for this visualization is sourced from the U.S. Census Bureau.
It averages three years of Current Population Survey results (2021-2023) to estimate how many residents in each state live below the federal poverty line.
Read the last section for more information on their methodology.
Four populous states—California, Texas, Florida, and New York—account for 13.5 million low-income residents, or more than one-third of all Americans in poverty.
California alone has 4.5 million people struggling to make ends meet, roughly the population of metropolitan Phoenix.
(Thousands, Sortable)
(Readable)
Americans in Poverty
While the Golden State’s higher cost of living may impact this figure, it also underscores how expensive housing can compound economic hardship, even in high-income states.
Fact: People in California have the lowest purchasing power in the country.
A fair criticism of this visualization is that it doesn’t account for population.
We previously mapped out poverty rates by state in the country to help cover this angle. The table below has the relevant figures.
in Poverty
In fact, California’s poverty rate is 12%, solidly middle of the pack.
But its 4.6 million poor residents are larger than the entire state of Oklahoma.
By contrast, Mississippi’s headline-grabbing 17% rate represents about 500,000 people.
Thus, a national food-assistance program needs almost nine times the meal budget for California, even though Mississippi is poorer than California.
Even within similar rate bands, scale varies wildly: Louisiana (18.9%) has 853,000 million people in poverty, compared with 388,000 in New Mexico (18.5%).
Thus, absolute numbers are also necessary to flag where to park mobile clinics, expand SNAP distribution sites, and hire caseworkers.
Fact: New Mexico also has the highest share of households on income or food support.
The way the Census Bureau calculates this line is important and can impact the data.
They use pretax household income against a threshold at three times the cost of a minimum food diet from 1963, adjusted for family size and inflation.
For reference, this is a quick guide on how much a household needs to be earning to be considered below the poverty line in 2023.
If you enjoyed today’s post, check out What is Costs to Buy a Home in America on Voronoi, the new app from Visual Capitalist.