


The U.S. population has seen significant demographic shifts over the last few decades, with notable increases in non-white populations, particularly among Hispanics and Asians.
This graphic, via Visual Capitalist's Bruno Venditti, breaks down the American population by race and/or ethnicity between 1990 and 2023.
The data comes from the Census Bureau and USAFacts as of August 2024.
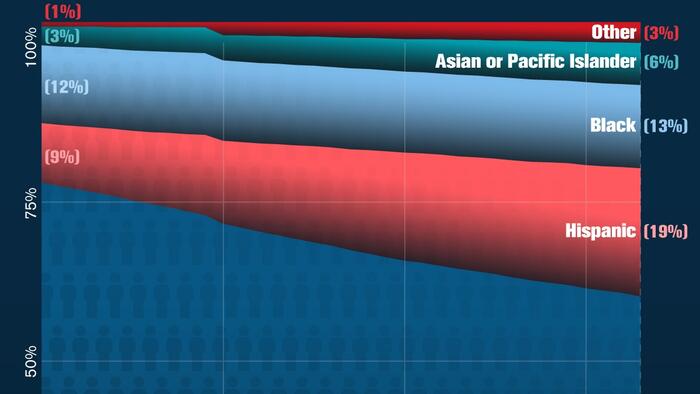
The nation’s non-white population has nearly doubled, growing from about 24.4% in 1990 to 41.6% in 2023. The majority of this growth came from the Hispanic population, which expanded from 23 million in 1990 to 65 million in 2023.
Meanwhile, the share of Black Americans rose modestly from 11.8% in 1990 to 12.6% in 2023.

More recently, the Asian or Pacific Islander population has become one of the nation’s fastest-growing racial and ethnic groups. Between 2000 and 2023, this group doubled its share of the U.S. population.
Population identifying as Other has also grown, from 1% to 3%. Generally speaking, this category is comprised of various Indigenous groups and people of two or more races.
In 2023, 58% of the population identified as non-Hispanic white, 20% as Hispanic, 13% as Black, 6% as Asian or Pacific Islander, and 3% as Other.
Between 2016 and 2060, the non-Hispanic white population is projected to decline by around 19 million, dropping from 198 million to 179 million, despite the overall growth of the U.S. population.
Meanwhile, the percentage of Hispanic children is expected to grow from one-quarter to nearly one-third, with the share of Asian children also seeing a notable increase during this period.
To learn more about racial diversity across the U.S., check out this map that shows which states have the most or least diversity.