The global shadow economy generates trillions in revenue each year, driven by criminal activity and other unreported transactions.
In low income countries, shadow activity makes up a larger slice of GDP, standing at an estimated 42.4% share. In comparison, this drops to 5.9% of GDP in rich countries, with the UAE seeing the smallest share overall.
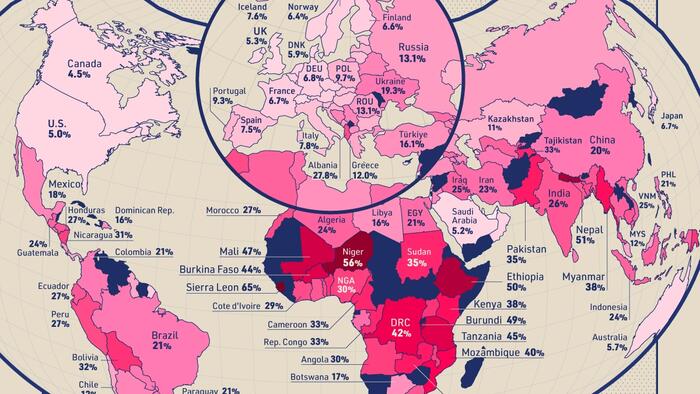
This graphic, via Visual Capitalist's Dorothy Neufeld, shows the size of each country’s shadow economy, based on analysis from the Ernst & Young Global Shadow Economy Report 2025.
To start, the shadow economy includes unreported or untaxed activity, making it difficult for authorities to monitor.
This includes illegal enterprises, drug trafficking, street vendors, or cash transactions made off the books. While measuring the informal economy is hard to quantify, it has shrunk from 17.7% of world GDP in 2000 to 11.8% in 2023.
Here are countries with the largest shadow economies as a share of GDP:
| Rank | Country | Shadow Economy
% of GDP in 2023 | Shadow Economy Value | GDP 2023 |
|---|
| 1 | ???????? Sierra Leone | 64.5 | $4.1B | $6.4B |
| 2 | ???????? Niger | 56.3 | $9.5B | $16.8B |
| 3 | ???????? Nepal | 51.0 | $20.9B | $40.9B |
| 4 | ???????? Ethiopia | 50.2 | $80.2B | $159.8B |
| 5 | ???????? Burundi | 49.2 | $2.1B | $4.2B |
| 6 | ???????? Mali | 46.8 | $9.5B | $20.2B |
| 7 | ???????? Tanzania | 44.7 | $35.4B | $79.1B |
| 8 | ???????? Burkina Faso | 43.8 | $8.9B | $20.3B |
| 9 | ???????? DRC | 42.1 | $28.2B | $66.9B |
| 10 | ???????? Mozambique | 39.8 | $8.4B | $21.0B |
| 11 | ???????? Kenya | 38.4 | $41.8B | $108.8B |
| 12 | ???????? Myanmar | 37.9 | $24.4B | $64.5B |
| 13 | ???????? Zambia | 35.6 | $10.0B | $28.2B |
| 14 | ???????? Pakistan | 35.0 | $118.1B | $337.5B |
| 15 | ???????? Sudan | 34.9 | $13.3B | $38.1B |
| 16 | ???????? Cameroon | 33.3 | $16.4B | $49.3B |
| 17 | ???????? Tajikistan | 33.2 | $4.0B | $11.9B |
| 18 | ???????? Benin | 32.9 | $6.5B | $19.7B |
| 19 | ???????? Congo | 32.6 | $4.6B | $14.2B |
| 20 | ???????? Bolivia | 32.1 | $14.6B | $45.5B |
| 21 | ???????? Papua New Guinea | 31.4 | $9.6B | $30.7B |
| 22 | ???????? Uganda | 31.1 | $15.2B | $48.8B |
| 23 | ???????? Lesotho | 30.9 | $0.6B | $2.1B |
| 24 | ???????? Malawi | 30.9 | $3.9B | $12.7B |
| 25 | ???????? Nicaragua | 30.7 | $5.5B | $17.8B |
| 26 | ???????? Angola | 30.2 | $25.6B | $84.8B |
| 27 | ???????? Nigeria | 30.0 | $109.1B | $363.8B |
| 28 | ???????? Bangladesh | 29.0 | $126.8B | $437.4B |
| 29 | ???????? Cote d'Ivoire | 28.8 | $22.7B | $78.9B |
| 30 | ???????? Togo | 28.1 | $2.6B | $9.2B |
| 31 | ???????? Albania | 27.8 | $6.5B | $23.5B |
| 32 | ???????? Peru | 27.1 | $72.5B | $267.6B |
| 33 | ???????? Morocco | 27.0 | $39.0B | $144.4B |
| 34 | ???????? Ghana | 26.8 | $20.5B | $76.4B |
| 35 | ???????? Honduras | 26.7 | $9.2B | $34.4B |
| 36 | ???????? Ecuador | 26.5 | $31.5B | $118.8B |
| 37 | ???????? Cambodia | 26.4 | $11.2B | $42.3B |
| 38 | ???????? South Africa | 26.3 | $100.1B | $380.7B |
| 39 | ???????? India | 26.1 | $931.1B | $3,567.6B |
| 40 | ???????? Vietnam | 25.1 | $107.9B | $429.7B |
| 41 | ???????? Iraq | 24.8 | $62.2B | $250.8B |
| 42 | ???????? Uzbekistan | 24.4 | $24.8B | $101.6B |
| 43 | ???????? Guatemala | 24.3 | $25.4B | $104.5B |
| 44 | ???????? Algeria | 24.2 | $59.9B | $247.6B |
| 45 | ???????? Thailand | 24.0 | $123.6B | $515.0B |
| 46 | ???????? Indonesia | 23.8 | $326.3B | $1,371.2B |
| 47 | ???????? Gabon | 23.1 | $4.5B | $19.4B |
| 48 | ???????? Iran | 22.5 | $91.0B | $404.6B |
| 49 | ???????? Georgia | 22.1 | $6.8B | $30.8B |
| 50 | ???????? Egypt | 21.2 | $84.0B | $396.0B |
| 51 | ???????? Tunisia | 21.2 | $10.3B | $48.5B |
| 52 | ???????? Colombia | 20.9 | $76.0B | $363.5B |
| 53 | ???????? Paraguay | 20.9 | $9.0B | $43.0B |
| 54 | ???????? Philippines | 20.7 | $90.5B | $437.1B |
| 55 | ???????? Brazil | 20.6 | $447.8B | $2,173.7B |
| 56 | ???????? China | 20.3 | $3,612.3B | $17,794.8B |
| 57 | ???????? SriLanka | 20.1 | $17.0B | $84.4B |
| 58 | ???????? El Salvador | 19.9 | $6.8B | $34.0B |
| 59 | ???????? Turkmenistan | 19.7 | $11.9B | $60.6B |
| 60 | ???????? Lebanon | 19.6 | N/A | N/A |
| 61 | ???????? Ukraine | 19.3 | $34.5B | $178.8B |
| 62 | ???????? Armenia | 18.9 | $4.6B | $24.1B |
| 63 | ???????? Bosnia and Herzegovina | 18.6 | $5.1B | $27.5B |
| 64 | ???????? Belarus | 18.3 | $13.2B | $71.9B |
| 65 | ???????? Jordan | 18.3 | $9.3B | $51.0B |
| 66 | ???????? Mexico | 17.9 | $320.2B | $1,789.1B |
| 67 | ???????? Argentina | 17.8 | $115.0B | $646.1B |
| 68 | ???????? Azerbaijan | 17.7 | $12.8B | $72.4B |
| 69 | ???????? Serbia | 17.2 | $14.0B | $81.3B |
| 70 | ???????? Botswana | 17.0 | $3.3B | $19.4B |
| 71 | ???????? North Macedonia | 16.9 | $2.7B | $15.8B |
| 72 | ???????? Libya | 16.3 | $7.4B | $45.1B |
| 73 | ???????? Dominican Republic | 16.2 | $19.7B | $121.4B |
| 74 | ???????? Türkiye | 16.1 | $180.0B | $1,118.3B |
| 75 | ???????? Costa Rica | 13.8 | $11.9B | $86.5B |
| 76 | ???????? Montenegro | 13.6 | $1.0B | $7.5B |
| 77 | ???????? Uruguay | 13.5 | $10.4B | $77.2B |
| 78 | ???????? Romania | 13.1 | $46.0B | $350.8B |
| 79 | ???????? Russia | 13.1 | $264.8B | $2,021.4B |
| 80 | ???????? Malaysia | 12.3 | $49.2B | $399.7B |
| 81 | ???????? Panama | 12.1 | $10.1B | $83.3B |
| 82 | ???????? Greece | 12.0 | $29.2B | $243.5B |
| 83 | ???????? Chile | 11.9 | $39.9B | $335.5B |
| 84 | ???????? Guyana | 11.8 | $2.0B | $17.2B |
| 85 | ???????? Kazakhstan | 11.2 | $29.4B | $262.6B |
| 86 | ???????? Mauritius | 10.6 | $1.5B | $14.6B |
| 87 | ???????? Bulgaria | 10.5 | $10.8B | $102.4B |
| 88 | ???????? Puerto Rico | 10.3 | $12.1B | $117.9B |
| 89 | ???????? Poland | 9.7 | $78.5B | $809.2B |
| 90 | ???????? Croatia | 9.3 | $7.8B | $84.4B |
| 91 | ???????? Latvia | 9.3 | $3.9B | $42.2B |
| 92 | ???????? Portugal | 9.3 | $26.9B | $289.1B |
| 93 | ???????? Hungary | 9.2 | $19.5B | $212.4B |
| 94 | ???????? Slovak Republic | 8.9 | $11.8B | $132.9B |
| 95 | ???????? New Zealand | 8.2 | $20.7B | $252.2B |
| 96 | ???????? Slovenia | 8.0 | $5.5B | $69.1B |
| 97 | ???????? Italy | 7.8 | $179.5B | $2,300.9B |
| 98 | ???????? Iceland | 7.6 | $2.4B | $31.3B |
| 99 | ???????? Korea | 7.6 | $130.2B | $1,712.8B |
| 100 | ???????? Malta | 7.5 | $1.7B | $22.3B |
| 101 | ???????? Spain | 7.5 | $121.5B | $1,620.1B |
| 102 | ???????? Estonia | 7.4 | $3.1B | $41.3B |
| 103 | ???????? Lithuania | 7.4 | $5.9B | $79.8B |
| 104 | ???????? Germany | 6.8 | $307.7B | $4,525.7B |
| 105 | ???????? France | 6.7 | $204.5B | $3,051.8B |
| 106 | ???????? Japan | 6.7 | $281.7B | $4,204.5B |
| 107 | ???????? Sweden | 6.7 | $39.2B | $585.0B |
| 108 | ???????? Austria | 6.6 | $33.8B | $511.7B |
| 109 | ???????? Belgium | 6.6 | $42.6B | $644.8B |
| 110 | ???????? Finland | 6.6 | $19.5B | $295.5B |
| 111 | ???????? Czechia | 6.5 | $22.3B | $343.2B |
| 112 | ???????? Norway | 6.4 | $31.1B | $485.3B |
| 113 | ???????? Oman | 6.4 | $7.0B | $108.8B |
| 114 | ???????? Netherlands | 6.3 | $72.7B | $1,154.4B |
| 115 | ???????? Luxembourg | 6.1 | $5.2B | $85.8B |
| 116 | ???????? Denmark | 5.9 | $24.0B | $407.1B |
| 117 | ???????? Australia | 5.7 | $98.5B | $1,728.1B |
| 118 | ???????? Israel | 5.5 | $28.2B | $513.6B |
| 119 | ???????? Bahamas | 5.4 | $0.8B | $14.3B |
| 120 | ???????? Cyprus | 5.3 | $1.8B | $33.9B |
| 121 | ???????? UK | 5.3 | $179.2B | $3,380.9B |
| 122 | ???????? Saudi Arabia | 5.2 | $55.5B | $1,067.6B |
| 123 | ???????? Ireland | 5.1 | $28.1B | $551.4B |
| 124 | ???????? Switzerland | 5.1 | $45.1B | $884.9B |
| 125 | ???????? United States | 5.0 | $1,386.0B | $27,720.7B |
| 126 | ???????? Canada | 4.5 | $96.4B | $2,142.5B |
| 127 | ???????? Kuwait | 4.0 | $6.5B | $163.7B |
| 128 | ???????? Singapore | 3.4 | $17.0B | $501.4B |
| 129 | ???????? Bahrain | 2.5 | $1.2B | $46.1B |
| 130 | ???????? Qatar | 2.2 | $4.7B | $213.0B |
| 131 | ????️ UAE | 2.1 | $10.8B | $514.1B |
As we can see, Sierra Leone ranks first overall, with its shadow economy equaling 64.5% of GDP.
Like many other sub-Saharan African countries, the informal economy employs millions of workers, including subsistence farmers, street vendors, and small business owners. Underscoring this trend are limited opportunities in the formal sector along with bureaucratic red tape.
In particular, the DRC stands out in both the scale of its informal economy and prevalence of organized crime.
Meanwhile, Nepal ranks third overall, with shadow activity accounting for 51% of GDP. Notably, the agriculture sector employs a substantial share of informal workers. In fact, 85% of Nepal’s labor force participates in the informal economy, making it a vital source of livelihood for many.
In contrast, America’s underground economy comprises just 5% of GDP, yet its sheer size—valued at $1.4 trillion—makes it one of the world’s largest.
To learn more about this topic from a violent crime perspective, check out this graphic on violent crime rates by U.S. state.


