


The Fear & Greed Index, created and popularized by CNN, is a powerful tool that captures investor sentiment and confidence levels. It rises when markets are greedy and falls when investors are fearful.
In this infographic sponsored by Fidelity Investments, Visual Capitalist's Rida Khan and Alejandra Dander compare the Fear & Greed Index with the CBOE Volatility Index (VIX) to see the connection between volatile markets and the impulses of investors.
The Fear & Greed Index combines the following indicators to see how much they differ from their averages.
The index gives each indicator equal weighting in calculating a score from 0 to 100, with 100 representing maximum greediness and 0 signaling maximum fear.
The VIX gauges expected price changes in S&P 500 Index options over the next month, indicating market volatility. It has lower values during bull markets and higher values during bear markets.
When these two indexes are correlated, it becomes evident that lowering market volatility corresponds to heightened investor greed.
This infographic highlights significant points emphasizing the relationship between the two indexes.
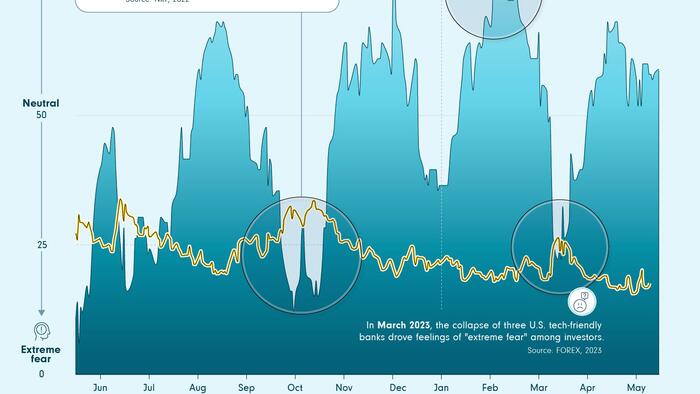
During this period, rising prices, interest rates, and the possibility of a recession led to the highest level of fear observed between May 2022 and May 2023.
February brought a breath of fresh air as GDP growth led to the highest levels of investor confidence during the period under study.
The collapse of three mid-sized tech-friendly banks triggered a wave of extreme fear. It served as a stark reminder of the inherent vulnerability of financial markets and how quickly panic can spread.
By proactively thinking about their emotional impulses, investors can better navigate volatile conditions, and what’s more, benefit from them.
Fidelity’s new market volatility guide provides invaluable insights, empowering investors to make informed decisions in unpredictable markets while avoiding emotional biases.