


Authored by Peter Tchir via Academy Securities,
According to Google, the MAG 7 are MSFT (+8% on the year), GOOG/GOOGL (both -2%), AMZN (+15%), AAPL (-6%), META (+36%), NVDA (+60%) and TSLA (-20%). Looks more like the “Magnificent 7” is more like the “Magnificent 4” with 3 of the alleged members down on the year and underperforming the S&P 500 and Nasdaq 100.
Purists will probably tell me I’ve used the term “moniker” incorrectly. So be it. I think continuing to refer to some mythical group as the “Magnificent 7” will do your portfolio far more harm than good. It isn’t helpful (any longer) and is likely detrimental as that narrative is hiding other, more important trends. None of that changes whether or not I’ve used moniker correctly, so I’m going to run with it.
In this weekend’s report A Global Game of Chicken we highlighted some of the challenges money managers face when stocks are such a large percentage of benchmark indices. We also highlight that the much maligned (I think we can use that word) Chinese stock market has outperformed the U.S. in February (we focused on FXI vs QQQ).
Far more (and in some ways, as we will demonstrate, far less) is going on in these markets.
I must admit, I did not know much about NVDL or NVDQ until last week. NVDL is a 2x leveraged ETF tracking one stock – NVDA. It looks like it was launched back in December 2022 and has accumulated almost $1 billion in AUM. Shares outstanding have increased significantly, with a big bump in August 2023 and another series of inflows starting at the end of January of this year. I will give credit for the inverse ETF’s ticker symbol (who doesn’t like to see a Q at the end of a ticker – it is commonly done once a company has gone bankrupt), but it isn’t surprising that ETF has only $12 million.
I bring these two ETFs up, as I’m not really sure why the world needs ETFs tied to a single stock, but also because CHATGPT helped me identify some other interesting symbols.
Remember FNGU? Back when FANG was the “moniker” of choice for a group of stocks allegedly driving everything. That ETF still has a market cap of over $4 billion, but shares outstanding are down around 80% from its peak in late 2022.
CHATGPT also found UWTSL, apparently a 3x leveraged TESLA ETN, but I couldn’t find any evidence of that – not sure whether it exists, did exist, or just sounded cool to CHATGPT (btw, it was the first ticker it presented in response to my single stock etfs and it didn’t come up with either of the NVDA ones). Not bashing AI,, but can’t say I’m horribly impressed versus other searches I might have conducted on my own. In theory that’s a story for another day, but given AI is quite literally the biggest driver in today’s market, maybe it shouldn’t be the story for another day?
When I was interviewing a guest on Bloomberg TV last Friday as guest host, I asked questions about whether the current state of data is good enough for all the current investments around AI. He effectively told me not to worry about it, as there is AI that is creating data. I tried not to visibly cringe.
While on the one hand, it makes a lot of sense for AI to be out their collecting, scrubbing and transforming data into usable forms, I couldn’t help but think of CDO^2 and the Great Financial Crisis.
Of all the issues that wound up hurting markets, the CDO^2 (or CDO squared) product deserves a lot of the blame (the mortgage backed securities at the heart of the crisis and referenced in ABX, of big short fame) were CDO squared. My view, which I think is absolutely correct, is that potentially small mistakes in the original model to create tranches, were amplified to extreme levels, when the model was used to tranche the tranches.
But again, I digress (or maybe, I’m actually not digressing given the importance of AI, its potential, couple with concerns of how ready for “prime time” it is, versus today’s spending).
So, here we are on this seemingly random walk, and we really haven’t reached any conclusions, except that:
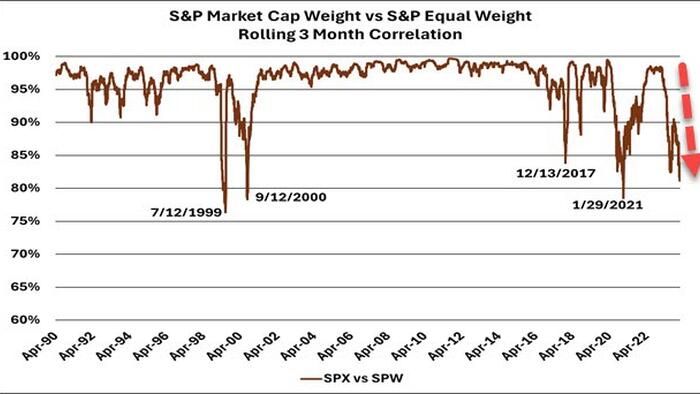
What started today’s piece, which I haven’t gotten to were a series of charts and thoughts I’ve been seeing on media (social and otherwise).
While I cannot today, recreate all these charts, I will copy one from a friend who is extremely good, and try and point you in the right direction on others.


The argument, with some historical evidence is that as the market returns become more “narrow” – i.e. lower correlations, we are susceptible to pullbacks.
I would not put on a single trade based on any of these charts or ideas. Collectively, though, they are more interesting. As a bear, they become very interesting.
I remain bearish on U.S. stocks for many reasons, and nothing I’ve written today, changes that view. For me, it only reinforces that view.
I do like Chinese stocks for a trade, and don’t understand why people want to fight the CCP?
I didn’t even get to mention treasury auctions as a reason to be bearish, but think that too will play a role as we debt and deficit chatter will fill the airways, especially once people get bored of hearing the old (and currently inaccurate) Magnificent 7 narrative.