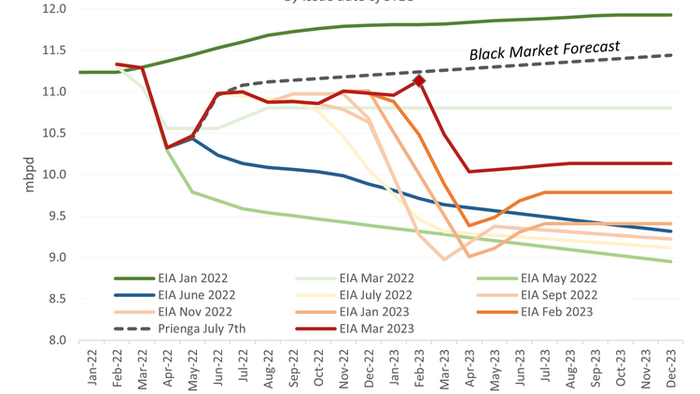


The EIA, the analytics arm of the US Department of Energy, published the February oil markets data in its latest STEO (Short-term Energy Outlook) yesterday. The EIA reports that Russian oil production rose to 11.13 mbpd in February, the highest since April 2022 and a whopping 1.1 mbpd higher than the EIA's forecast from two months ago.
In fact, as visible on the graph above, the EIA has been 'forecast surfing' since last July. That is, the EIA anticipated that embargoes and price caps would precipitate production declines, particularly related to the more difficult market in refined products. Month after month, the EIA forecast that, although production declines had not yet kicked in, they would soon begin. Thus, the EIA has published a series of forecasts showing a cascade of anticipated production declines, with the Russians thwarting expectations month after month. The visual impression, as one can see on the graph above, is of a kind of 'forecast surfing', as though the actual data were surfing on an ocean wave.
Why has the EIA proven so wrong to date? And why has our forecast from last July -- the Black Market line on the graph -- proven so much more accurate?
In general, the EIA's track record for forecasting is about as good as one will find, whether from the investment banks like Goldman Sachs or from specialised consultancies like S&P Global. The EIA is staffed with competent, dedicated professionals with long-tenure as a rule. So why the miss month after month for Russian oil production?
The EIA's models are built on market forecasts, emphasizing elements like customer requirements and tanker availability. There is nothing wrong with this, as oil is normally traded under market conditions (with some exceptions regarding OPEC). By contrast, our forecast from last July is a black market forecast, that is, it operates under a different set of assumptions. Chief among these is that prohibitions -- whether on quantities like the EU embargo or on prices like the oil price cap -- tend to lead to evasion accompanied by vast corruption and unbounded hypocrisy. Thus, we assumed that the Russians would find a way around the sanctions, and the numbers to date suggest this in fact has happened.
The shape of our forecast comes from historical data on black markets, most notably from the US Prohibition era, when alcohol consumption was illegal in the United States. As the graph below shows, Prohibition was initially successful, but within two years consumption had returned to levels only modestly below that of the pre-Prohibition era.
The Russian production data show a similar pattern, with the exception that the recovery took two months, not two years. This is no surprise, given that the various oil sanctions do not apply to much of the globe, including India, China and the Middle East. Overall, however, we see the same pattern: initial success of the sanctions followed by a supply recovery to a level modestly lower than the pre-prohibition state. We made our Russian oil forecast using this approach, and to date it has held up better than the EIA's numbers. This, again, is not due to superior forecasting technique, but rather the use of an entirely different forecasting paradigm.
Forecasting is, of course, a precarious endeavor. The Russians have announced oil production cuts equaling 650,000 bpd, and these should begin to manifest in the March data. If the EIA is not entirely right, it may not be entirely wrong either. Still, the Russians are likely to find ways around embargoes and price caps. The more time passes, the more successful they will be. That is what a black market model suggests.
All of this is of moderate interest. Of greater interest are the other manifestations of black markets. For example, the model suggests that the sanctions and price caps are drawing China into the war on the Russian side -- a topic which we will address in another post.

