
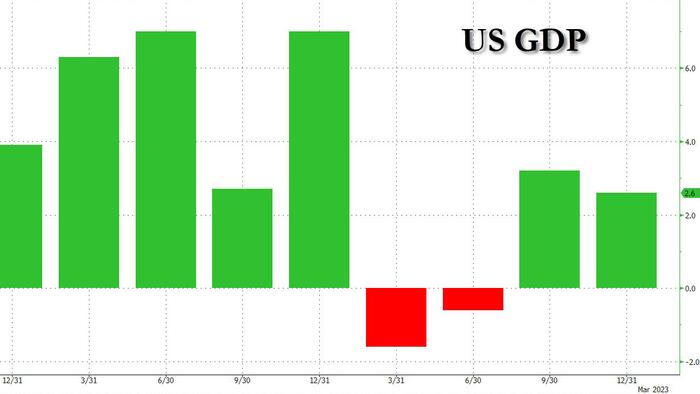
In the least relevant data point on what will otherwise be a quiet day on the data front, moments ago the BEA reported its third and final Q4 GDP estimate (to be fair this number will still be revised numerous time in coming years), and it continued the trend of declines, having printed 2.9% in the first estimate in January (above the 2.6% estimate), it then dropped to 2.7% in the second estimate in February, and it is now down again to 2.6%, exactly where the original Q4 GDP estimate was primarily reflecting downward revisions to exports and consumer spending, , and a master class in how you can "buy" two quarters of "above average" growth before converging with the original estimates. And for those keeping track, the most recent consensus estimate for Q4 GDP was 2.7% so technically we missed.
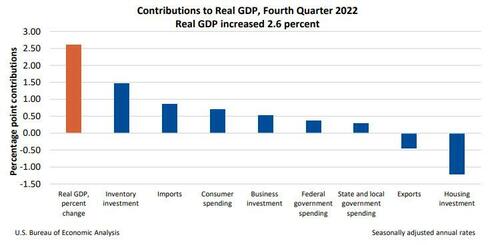
According to the BEA, the Q4 compared to Q3 increase in real GDP reflected increases in inventory investment, consumer spending, business investment, federal government spending, and state and local government spending that were partly offset by decreases in housing investment and exports. Imports, which are a subtraction in the calculation of GDP, decreased.
The increase in private inventory investment was led by manufacturing (mainly petroleum and coal products) as well as mining, utilities, and construction industries (led by utilities).
Meanwhile, comparing the final Q4 GDP to the second estimate, it was revised down 0.1% "primarily reflecting downward revisions to exports and consumer spending. The price index for GDP increased 3.9 percent in the fourth quarter, unrevised from the previous estimate."
A look at the detailed breakdown:
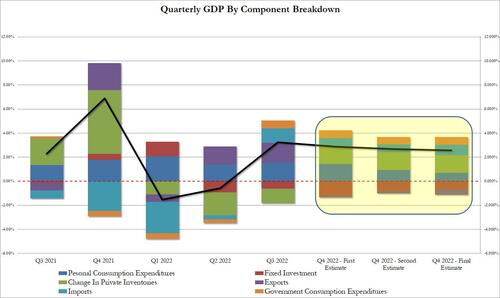
And visually:
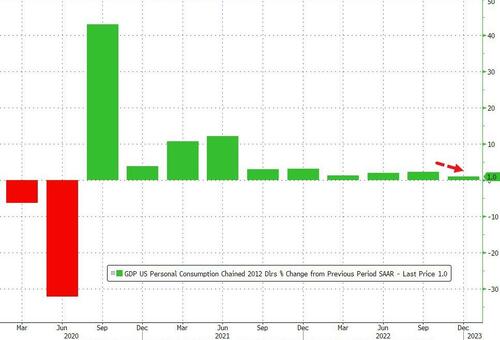
Of the above data, two things stuck out: the outsized contribution by inventories at 57% of the bottom line number, and the sharp drop in annualized Personal Consumption, which rose just 1.0%, or the least since the covid crash in Q2 2020.
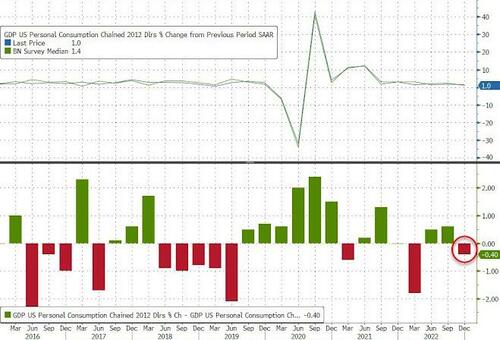
The Personal Consumption number dropped from 2.3% in Q4, and missed the estimate of 1.4% by the widest margin since Q2 2022.
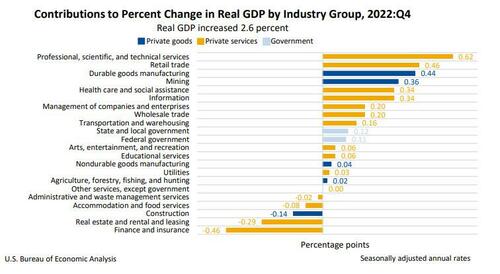
As an aside, today’s release includes estimates of GDP by industry, or value added—a measure of an industry’s contribution to GDP. Private goods-producing industries increased 4.0 percent, private services-producing industries increased 2.3 percent, and government increased 2.1 percent. Overall, 17 of 22 industry groups contributed to the fourth-quarter increase in real GDP.
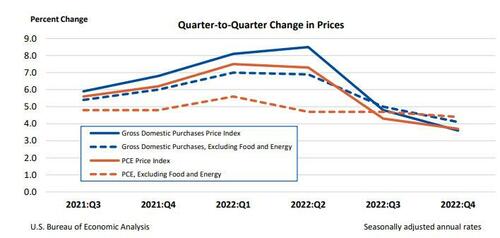
While growth slowed down, the inflation components in the GDP report came in hotter than expected, with the Core PCE rising 4.4%, above the 2nd estimate of 4.3% which was also the median consensus. The silver lining: the headline GDP price index rose 3.9% in 4Q after rising 4.4% prior quarter; at least this number came in line with expectations.
Some more details from the BEA: "Gross domestic purchases prices, the prices of goods and services purchased by U.S. residents, increased 3.6 percent in the fourth quarter after increasing 4.8 percent in the third quarter. Excluding food and energy, prices increased 4.1 percent after increasing 5.0 percent."
Personal consumption expenditure (PCE) prices increased 3.7 percent in the fourth quarter after increasing 4.3 percent. Excluding food and energy, the PCE “core” price index increased 4.4 percent after increasing 4.7 percent.
Putting it all together, today's report was downright stagflationary, because while inflation remains hot and well above the Fed's (pre-revision) 2% target, consumption continues to shrink, and as Joe Lavorgna notes, "real consumption was revised down 40 bps to 1.0%. There isn’t much momentum as a potential commercial bank credit crunch looms. Last qtr is (non-pandemic) weakest since Q1 2019 (0.4%)"
And now we wait for the looming credit crunch courtesy of the bank crisis to send Personal Consumption negative.

