

Authored by Mike Shedlock via MishTalk.com,
Everything has gone right for homebuilders for a long time. How much better can things get?
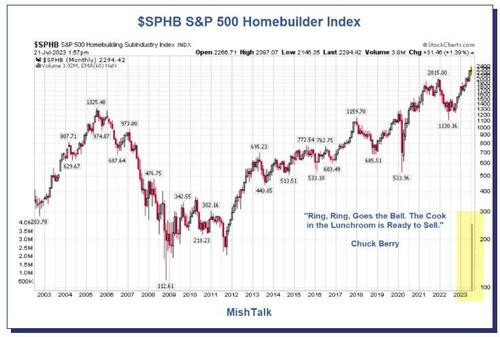
$SPHB S&P 500 Homebuilder Index courtesy of StockCharts.Com, annotations by Mish
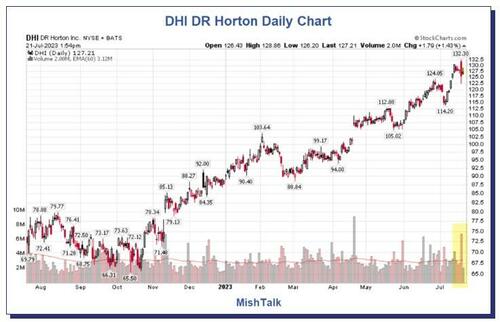
Homebuilder DHI daily chart courtesy of StockCharts.Com, Annotations by Mish
Bloomberg comments Homebuilders Rally Stalls After D.R. Horton Disappoints Bulls
D.R. Horton, which targets the entry-level housing market where inventory scarcity is most pronounced, blew away estimates but fell short on bullish expectations for new orders, according to Wall Street analysts.
Amid a 48% rally in D.R. Horton this year, traders have been in no rush to pile on hedges to guard themselves against losses. Earlier this week, the cost of contracts protecting against a 10% decline in the stock in the next month relative to bets for gains of the same magnitude fell to the lowest level since March, data compiled by Bloomberg show.
Tyler Batory, an analyst at Oppenheimer & Co. commented, Investors “might make the argument this is as good as it can possibly get.”
Yes, that is exactly what I am suggesting.
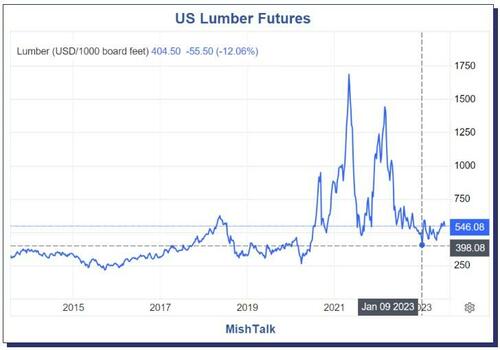
Lumber futures courtesy of Trading Economics.
How much more lumber price cost reductions can homebuilders pass on?
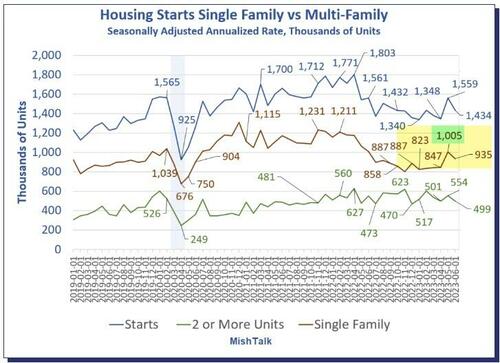
Housing data from the Census Department. Chart by Mish.
For more discussion, please see Housing Starts Dive 8 Percent in June on Top of Significant Negative Revisions
I keep hearing talk from the NAR cheerleaders of pent up demand. Perhaps, but at what mortgage rate, and what price level?
Homebuilders were able to adjust to Fed rate hikes, but how more more low hanging fruit is left?
Meanwhile, there are significant signs of consumer stress.
ZeroHedge noted Credit Scores Abruptly Plunge As Americans Stop Paying Down Debt; Synchrony Financial Warns
“What we are seeing is people who are doing significant score migration — a 680 or a 690 going to a 620,” Synchrony Financial CFO Brian Wenzel said in an interview.
That’s a dive from good to fair.
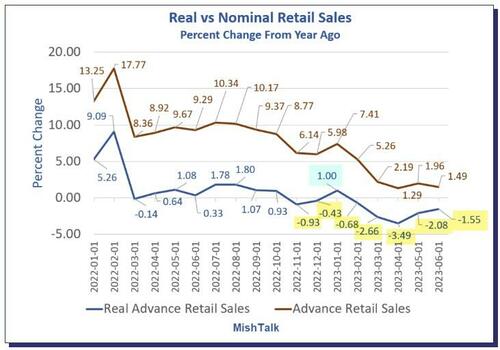
Real vs nominal retail sales percent change from year ago, data from Commerce Department, chart by Mish.
On July 18, I noted Inflation-Adjusted Retail Sales Weak Four of the Last Five Months
It’s not just consumers.
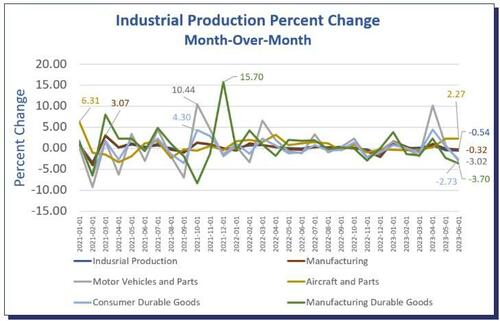
Industrial production data from the Fed, chart by Mish
Please note The Fed Reports Abysmal Industrial Production Numbers and Negative Revisions Too
The Bloomberg Econoday consensus estimate was unchanged in May from June. Instead, Industrial production fell 0.5 percent and the Fed revised May from -0.2 percent to -0.5 percent.
Meanwhile, the consensus opinion has changed from recession to soft landing. Ring, ring goes the bell.
* * *

