


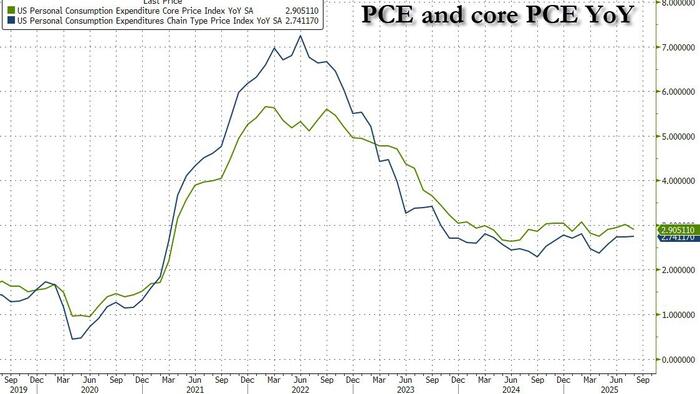
After a modest increase two months ago, and a steady print in July, analysts expected headline PCE to be steady at +2.6% YoY in August and Core PCE - the Fed's favorite indicator - to also be unchanged at 2.9% YoY... and the numbers all came in right in line with expectations.
Indeed, "as expected" is the them of this morning's data with headline and Core PCE both matching expectations and staying in the same range they have been in for two years... not exactly the Trump Tariff terror future that every "respected" economist predicted.
On an annual basis headline PCE was flat at 2.741%, while core PCE actually dipped modestly to 2.905 in August.
All those expecting a bounce in Durable Goods inflation will have to wait another month: in August it actually declined again, as did Nondurable Goods, while Services costs increased the most.

Headline PCE rose 0.2% MoM (as expected) and +2.6% YoY (as expected)...

Core PCE rose 0.3% MoM (as expected) and +2.9% YoY (as expected)...

For the second month in a row, Financial Services costs (i.e., soaring stock market and associated services) dominated SuperCore prices (and certainly have nothing to do with tariffs at all). Food services and transportation costs also boosted Supercore.

While prices are rising but in their recent normal range, income and spending both came in a fraction hotter than expected, up 0.4% MoM (above exp. 0.3%) and 0.6% MoM (above exp. 0.5%) respectively...

The historical change in personal income and spending in nominal dollars is shown below. The Covid breach is still brutally clear.

On the income side, there was more good news: after outpacing the private sector for nearly three years, wage growth of private workers (5.0% YoY) is once again rising faster than government workers. In fact, government worker wage growth of 4.2% was the lowest since August 2021.

With spending growth outpacing income, it naturally meant that consumer had to dig into their savings, and sure enough the personal savings rate dropped to a new 2025 low of 4.6% from 4.8%, which in turns follows the comprehensive data revision published yesterday, and which lifted the savings rate by about 1% across the board historically (the various data revisions are shown below).

Yet while it dipped, it is isn't exactly screaming that the US consumer is struggling with a savings rate at 4.6% of disposable personal income.