

Authored by Lance Roberts via RealInvestmentAdvice.com,
Recently, I did an interview about “buying the dip” in the market, which generated many comments. Most were, “You’re stupid; the market is going to crash,” but one comment deserved a more thorough discussion.
“When buying the dip, how do you know when to do it, or not?”
That is the right question. Of course, you will never know with certainty. However, we can use some rather simplistic analysis to improve our odds of “buying the dip” more successfully. But, before we get to the analysis, let me clarify one critical misconception.
In recent years, “buying the dip“ and more vulgar variations have often been equated to “dumb money” or retail investors, who are presumed to always make a mistake. However, as investors, we need to rethink how we view “buying the dip” because the whole goal of investing is to “buy low and sell high.” As such, we need to analyze corrective processes in the market. Sometimes, a correction may appear over, but it is only the beginning. At other times, the correction is near completion, and our odds of “buying low” vastly improve. But how can we know the difference?
Let me restate that neither I nor anyone else has a guaranteed method of “buying the dip” precisely at the bottom. That is not the goal of this discussion. This discussion aims to look primarily at two factors, sentiment and technicals, to improve the odds of “buying low” versus “buying high.”
Investor sentiment refers to investors’ overall attitude or emotional outlook toward the stock market. Sentiment measures reflect the collective mood, whether optimistic (bullish), pessimistic (bearish), or neutral, based on market performance, news, psychological biases, and positioning. While we do measure sentiment through surveys like the AAII Investor Sentiment Survey, market indicators such as put-call ratios and the volatility index (VIX) are also essential to consider.
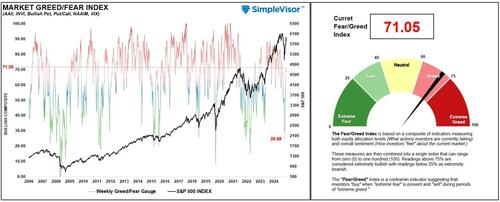
In this regard, we constructed a broad sentiment gauge that includes retail and professional sentiment (how they feel about the market), the put-call ratio, VIX, the percentage of stocks on bullish buy signals, and retail and professional allocations to stocks. This gauge is based on weekly data and is published weekly in the #BullBearReport. The following is a recent example of that gauge overlaid against the S&P 500 index.
What should be evident is that when the gauge is above 80, particularly above 90, such has typically coincided with market peaks. However, when the indicator is at these levels, investors are generally exceedingly bullish and tend to be “buying high.” Conversely, when the indicator is at very low levels, investors are usually “selling low.” However, history shows that extremely low readings are generally better opportunities for “buying the dip” than not.
There are several reasons why this is the case.
Contrarian Indicator: Extreme sentiment often signals reversals. When investors are overly bullish (e.g., excessive buying, high confidence), it may indicate a market peak, as most buyers are already invested, leaving little room for further gains. Conversely, extreme bearishness (e.g., panic selling, widespread fear) often marks market lows, as selling pressure may be exhausted, creating rebound opportunities.
Herd Behavior: Sentiment drives herd mentality, amplifying price movements. At peaks, euphoria can lead to overvaluation as investors pile in. At lows, fear can cause undervaluation as investors exit en masse.
Market Psychology: Sentiment reflects psychological biases like greed and fear, which can disconnect prices from fundamentals. Understanding sentiment helps identify when markets are driven by emotion rather than value.
Timing Entry/Exit Points: Investors use sentiment to time trades. For example, high bullishness may prompt contrarians to sell, anticipating a correction, while extreme bearishness may signal a buying opportunity.
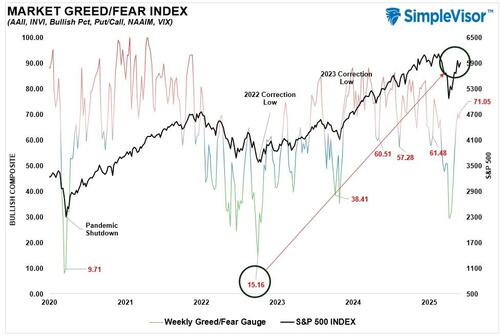
As shown, there are some good examples:
Using sentiment as a “contrarian” indicator can assist investors in better navigating potential turning points.
However, it’s not foolproof and should be paired with other analyses.
Notably, “sentiment” can also be analyzed in ways other than measures of “feelings” or allocations. We can also measure sentiment by analyzing the market price, which reflects the imbalance of buyers and sellers in the market at any given time. In other words, while there is a buyer and seller in every transaction, the “supply and demand” of those participants determines the price. Let me explain.
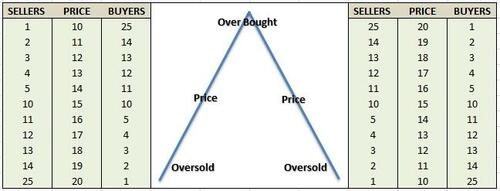
Imagine two rooms with 100 individuals each who want to buy shares of ABC stock. Room A has 100 individuals who currently own ABC stock, and Room B has 100 individuals with cash who want to buy shares of ABC. The table below shows a very simplified model of this process.
At $10 a share, there are numerous buyers but few sellers. The demand for the shares drives the price higher, which entices more sellers.
As long as the demand for shares outpaces the supply of sellers, the price rises. However, at some point, the price reaches a level that exhausts the supply of buyers. The subsequent price decline occurs as sellers have to begin lowering prices to find buyers.
So, “Yes,” for every buyer, there is a seller. But the question is always, “What price?”
Since the “supply/demand imbalance” determines the price, it is logical that investors can determine what “price” buyers and sellers have previously been most active at by using historical prices. Hence, “overbought” and “oversold” conditions determine the risk/reward of owning stocks. Technical analysis helps measure these imbalances.
Technical analysis uses historical price and volume data to identify patterns and signals that suggest when stocks are overbought (likely to correct downward) or oversold (likely to rebound upward). By analyzing these conditions, investors can make informed decisions to reduce risk or capitalize on buying opportunities. Tools like Bollinger Bands, RSI, MACD, Stochastic Oscillator, volume, and others can help investors visualize where previous similar conditions resulted in either a correction or a “buying the dip” opportunity.
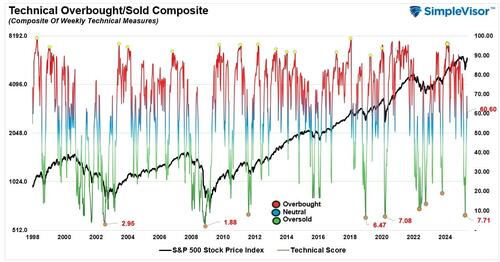
Our analysis combines these indicators into a single index to help confirm current market conditions. As with the sentiment gauge above, we publish a “technical gauge” weekly in the #BullBearReport. This gauge combines the abovementioned indicators into a single index using weekly price data. The reason for using weekly data is that it slows price movements to provide a clearer picture of market sentiment. Again, as with the sentiment gauge above, the Technical Gauge signals potential market peaks (readings above 90) and seize opportunities of “buying the dip” at potential lows (readings below 20). However, investors should integrate technical signals with fundamental analysis and sound risk management to avoid false signals and optimize outcomes.
The chart below is a recent example of the gauge. It is worth noting that the best “buy the dip” opportunities occurred with readings below 10. Those readings happened at the bottom of the market in 2002, 2009, 2011, 2018, 2020, and April 2025. In every case, that was the market low and rallied significantly higher following those readings.
What is important to note is that the exact dates on which the market was deeply oversold on a purely sentiment and allocation basis (shown above) also coincided with deeply oversold technical conditions. Investors are emotionally driven, and during price declines, “sellers” eventually exhaust themselves. As noted above, with a lack of sellers, “buyers” can enter the market at lower prices and begin to reverse price trends.
The problem is that “buying the dip” isn’t easy.
In hindsight, it is pretty easy to see that using these tools to enter or exit the market benefits investors. However, in real time, it isn’t easy. This is because we become the two primary behavioral biases: herding and loss avoidance.
When markets are aggressively rising, and the sentiment and technical gauges are at very elevated levels, investors don’t want to sell because “everyone” expects the market to go higher. The media erupts with headlines about the “bull market” and provides all the rationalizations that feed our “fear of missing out” on further advances. With the “herd” chasing stock prices higher, we fail to take profits and reduce risk.
Conversely, when both measures signal a deeply oversold market, we find reasons to dismiss “buying the dip,” due to fear of further losses. Unfortunately, investors generally sell at the lows, trying to “avoid further losses.”
Crucially, these behaviors amplify market extremes, causing investors to buy high during herd-driven rallies and sell low due to loss-averse panic. This is why both measures discussed above, sentiment and price analysis, directly visualize these behaviors. However, while “buy low, sell high” sounds simplistic, it is challenging to execute in real time. This is why we regularly discuss the importance of “contrarian investing”: to counteract the psychological, emotional, behavioral, and market-driven factors that plague investor outcomes.
The biggest challenge for investors is always being patient and waiting for the “fat pitch.” When we examine the sentiment and technical indicators in more detail, we find their validity is at the extremes, not in the middle. In other words:
“The “herd” tends to be right in the middle of a move but wrong on both ends.”
With both weekly technical and sentiment measures in the middle, and the market rising, the odds favor a market that will continue to increase further. In other words, don’t bet against the bulls during a bullish trend in the market, and vice versa.
However, as markets become more extended technically and sentiment becomes more bullish, “buying the dip” becomes less profitable and more risky. In the example, volatility increases as sentiment reaches higher levels. This is because buyers begin to lose control over demand as sellers increase. While momentum tends to carry prices higher, the gains of buying with increased bullish sentiment are far less than buying when sentiment is exceedingly bearish.
However, waiting for that opportunity is the hard part. As we quoted in the linked article above on contrarian investing:
“Resisting – and thereby achieving success as a contrarian – isn’t easy. Things combine to make it difficult; including natural herd tendencies and the pain imposed by being out of step, particularly when momentum invariably makes pro-cyclical actions look correct for a while. (That’s why it’s essential to remember that ‘being too far ahead of your time is indistinguishable from being wrong.
Given the uncertain nature of the future, and thus the difficulty of being confident your position is the right one – especially as price moves against you – it’s challenging to be a lonely contrarian.” – Howard Marks
As investors, we must focus on the things that continually lead to poor outcomes.
Being a contrarian does not mean always going against the grain regardless of market dynamics. However, it does mean that when “everyone is bearish,” that is often when “buying the dip” is the most opportunistic.


