


Authored by Elena Popina via Bloomberg,
Chart watchers looking to technicals to assess the recent rally are taking positive cues from measures of market breadth that are expanding in ways that have signaled further gains in the past.
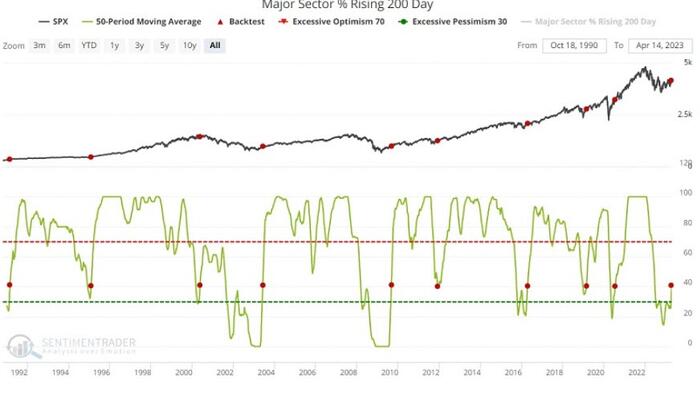
The trend is particularly pronounced among 200-day moving average lines, a tool for judging long-term momentum in the market. The line has risen for more than 40% of the S&P 500’s 11 industry groups in the past month and half, data compiled by SentimenTrader show. That hasn’t happened since the summer of 2020.
The nine other instances going back to 1991 when the signal has occurred have all preceded gains in the S&P 500 Index, with a 6.4% average advance. The gauge has posted a mean 15% rally a year after, with advances 89% of the time.
While rebounding participation is just one of the many signals on chart watchers’ radar, it shows the longer-term performance trend of the S&P 500 is gaining momentum. The gauge’s own 200-day moving average line, which captures the momentum between now and late June, went up for 12 straight days, a streak last seen a year ago.
“For now, history suggests that a favorable trend may be forming under the noses of many investors,” SentimenTrader’s Jay Kaeppel said in a note to clients.
That said, there’s more room for improvement. The share of S&P 500 constituents with a rising 200-day moving average line needs to go from above 40% to above 70% to confirm that a bull market is in full force, the analysis by SentimenTrader shows.
Further signs of strengthening equities will be welcome news for actively managed funds where lackluster breadth contributed to a dismal first-quarter performance, an analysis conducted by Bank of America showed.
Only one in three actively managed mutual funds was ahead of equity benchmarks during the first quarter, the worst performance since the end of 2020, data compiled by Bank of America Corp. show. That contrasts with a hit rate of 47% in 2022 that was the best in five years.
The Nasdaq 100 Index, which rallied 20% last quarter, has outperformed the Russell 3000 Index by the most since 2001.
So far, the Russell 3000 has yet to see a pickup in equity participation. While the gauge is hovering less than 2.5% below its early-February high, only 43% of its constituents trade above the 200-day support line, compared with 71% in February.
But it’s not just technicals; positioning data is showing a move higher, too. A gauge of aggregate positioning among discretionary and rules-based investors tracked by Deutsche Bank Group AG rose to near a neutral reading last week after falling from neutral to half-way back to the bottom during the banking turmoil in March, the bank’s data show.