
Authored by Mike Shedlock via MishTalk.com,
Assuming no recession, will employment rise or fall this year?
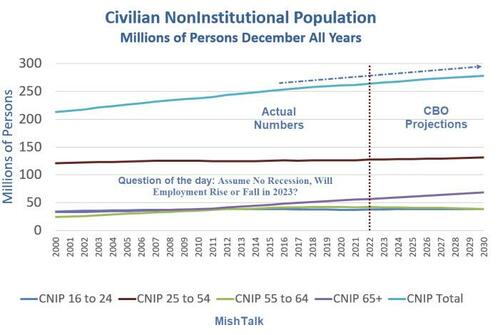
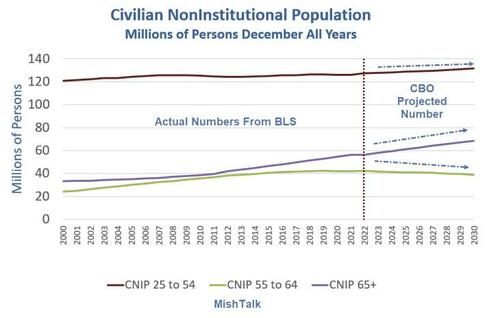
Civilian Noninstitutional Population from BLS, projections by the CBO, chart by Mish
Persons 16 years of age and older residing in the 50 states and the District of Columbia, who are not inmates of institutions (e.g., penal and mental facilities, homes for the aged), and who are not on active duty in the Armed Forces.
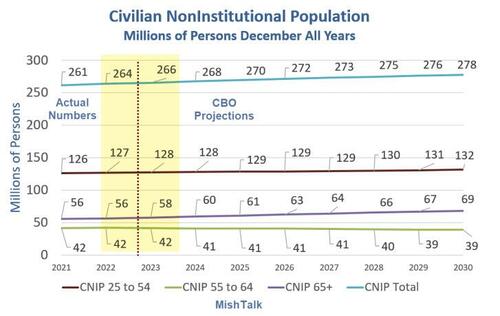
Civilian Noninstitutional Population from BLS, projections by the CBO, chart by Mish
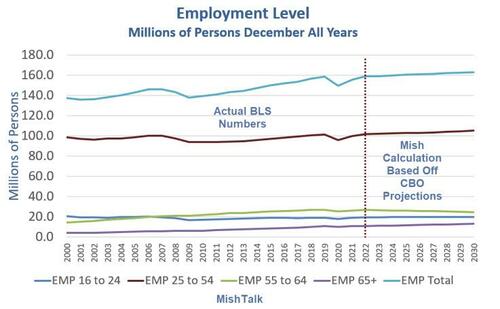
Employment levels from the BLS through 2022, 2023-2030 Mish projections
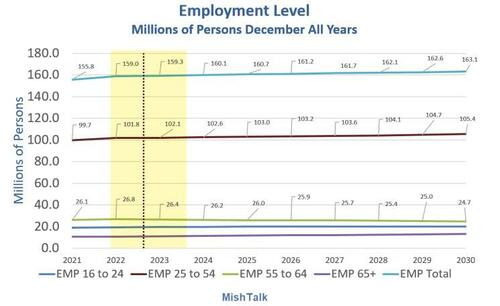
Employment levels from the BLS through 2022, 2023-2030 Mish projections
Based on those assumptions, I project a mere rise in total employment for the year of about 300,000.
Looking further ahead the total employment gain from 2022 to 2030 is a mere 4.1 million in 8 years.
Does this make any sense? Yes, it does. Let's start with a look at participation rates.
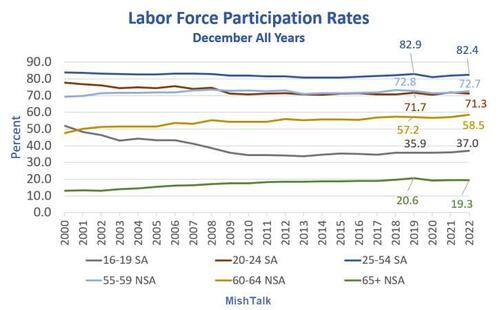
Labor force participation rates 2000-2022 from BLS
Note that in my example above, I used an employment ratio of 80.0 percent.
The unemployment rate for age group 25-54 in December of 2022 was 2.9%. Subtracting 2.9 from 82.4 yields 79.5 nearly spot on to the slightly higher number that I used.
To understand why employment is so stagnant, let's hone in on the demographic reason.
Civilian Noninstitutional Population from BLS, projections by the CBO, chart by Mish
The above chart fully explains my stagnant employment projections.
People are rapidly shifting from high participation rates to much lower ones.
For 2023, the CBO estimates a 2023 increase in the age 65+ population of 2 million and that 2 million accounts for the total rise in population.
There is a big difference between participation rates of 55-59 (72.7) and 60-64 (58.5). Unfortunately the CBO did not provide that breakdown.
Similarly, there is a big difference between participation rates of 16-19 (37.0) and 20-24 (71.3). Again the CBO did not provide that breakdown.
My employment projections through 2030 are more likely to be off in one direction or another due to those missing numbers than any of the other assumptions.
Again, the baseline assumption is no employment losses due to a recession!
Finally, by 2030, the CBO projects the 16+ population will grow by 14 million while I project employment based off demographic trends will only rise by 4.1 million.
Importantly, of the 14 million population increase, 13 million of it will be in age group 65+.
Think about that for a second including strains on Medicare and Social Security.
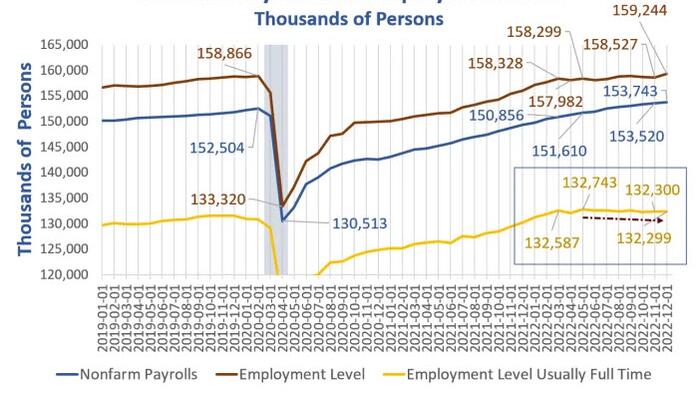
Payroll and employment data from the BLS, chart by Mish
Full time employment is down 288,000 since March and down by 444,000 since May!
For discussion, please see December Jobs: Employment Rises by 717,000 All of Them Part Time
Also note that The BLS Reports Employment in the Second Quarter Fell By 287 Thousand
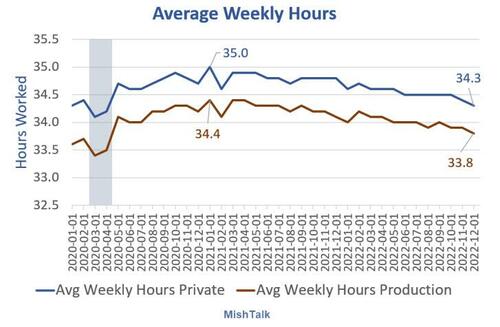
In addition the average number of hours worked is declining.
Data from BLS, chart by Mish
For discussion, please see Average Work Week Has Peaked and Total Aggregate Hours Is Rolling Over
Demographics explain the alleged "noise" in falling full time employment while job growth allegedly growing by leaps and bounds.
Job growth, if real (which I doubt), consists of people taking second part time jobs to make ends meet.
Given my charts assume no recession (or no significant layoffs in recession), what happens if there is one?
* * *

