

By Peter Tchir of Academy Securities
I really didn’t want to write about the Fed this weekend and have the 10,000th report that barely gets glanced at. I would much rather have followed up on Academy’s latest Around the World report from Thursday (which addresses Russia/Ukraine, Japan’s Military, Iran/Russia, Turkey/Greece, and Brazil & Peru) with World War v3.1. World War v3.1 will explore the shift from a “Commodity War” (which is being fought) to the potential for a “Semiconductor War”. Fortunately, that report can wait a couple of days and I cannot hide from how powerful the equity rally was last week. The S&P 500 was up 2.5% and the Nasdaq was up 4.3%. ARKK was up 10%, though that segment had been washed out, so outperformance there was more in line with views. I did say that “if there was a gun to my head” the move could be higher for stocks, but no one put the gun to my head. Ugh!
The stock market returns were accompanied by Treasuries doing very little (2s through 30s moved less than 3 bps in most cases on the week). That was interesting.
Energy futures were down 1% to 4% across the board last week (heating oil was down 6%, but I can guarantee that this won’t get passed on to me by my provider). Even copper was down on the week despite the near frantic hype about China’s re-opening (it is up 11% on the month though, giving some credence to the importance of the China re-opening).
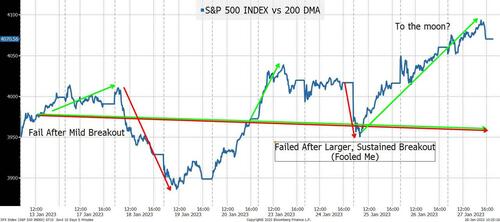
We also have a market where literally everyone (yes, even my mom) is talking about the 200-day moving average! It is one of those rare occasions when even “fundamentalists” (those who look down on “mere technicians”) are spouting technical levels especially if they are bullish, which is the direction fundamentalists seem to be leaning the vast majority of the time.
When we broke below the 200 DMA the morning after MSFT’s earnings call (triggered by the warning of future cloud earnings, which fits my 5 steps forward, 2 steps back theme), I thought that we would catch a lot of weak longs and the breakdown would continue. I was wrong and Tesla (among others) propelled us right back above the 200 DMA and set a true “feeding frenzy” into motion.
Technically, I don’t think that it is a Venn diagram, and I eventually gave up trying to make the chart, but there is an interesting subset of people out there.
At least Larry Summers, who was panicking about inflation, seems to have jumped all the way into “the Fed needs to slow” camp.
At this point, the Fed’s options boil down to a couple simple scenarios. It has a “woulda, coulda, shoulda” feel to it.
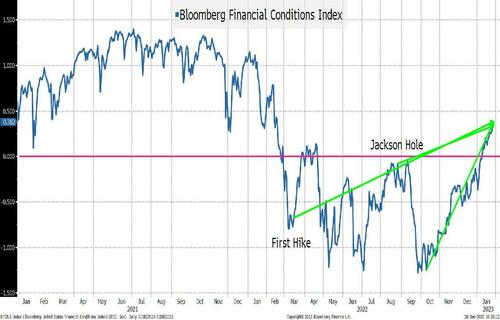
At this point I believe that markets have priced in what the Fed “should” do and not what the Fed “will” do.
Let’s start with the new issue calendar. We are almost 1 month into the year and we are at $138 billion, which is down 8% from last year. That is an especially slow start when you consider Q4 finished with an anemic $205 billion.
Many investors were expecting a much higher new issue volume to start the year (and they presumably set aside dry powder for those expected new issues).
The entire Treasury curve is around levels last seen in September.
The Bloomberg Corporate OAS, at 119, is lower than at any time since April.
I’m looking at all-in corporate yields and telling investors to be very cautious here. Issuers should be taking advantage of not only reasonable all-in yields, but the dry powder that asset managers were hoping to put to work and presumably need to (or want to) put to work now!
For all-in yields to do better, we need lower Treasury yields with spreads close to today’s levels. That could happen with a small move in rates, but I suspect that for 10s to get back to sub-3% it will take serious recession fears and that will not be good for corporate credit.
As Treasury yields move lower, spreads will widen at something close to a ½ bp for every bp. However, spreads could easily blow out faster on any real concerns. One nice thing is that some of the companies experiencing the biggest re-valuations in their equity prices are incredibly stable from the credit side.
If Treasury yields go higher (for any number of reasons) it is extremely difficult for spreads to compress. This would be under a “normal” scenario of yields rising because the economy and growth both look good. Spreads can tighten, but there isn’t a ton of room. If Treasury yields were to go higher on some dearth of dollar denominated debt buying, then spreads could widen while Treasury yields go higher. Not my base case, but it is possible. I am hearing that the strong auctions this week were not only due to the Fed’s potentially less hawkish message, but also because people want to buy debt before the debt ceiling debate potentially affects issuance.
I just don’t find all-in corporate bond yields compelling here, and I’d be taking advantage of the dry powder out there if I was an issuer.
Retail sales have been weak (even adjusted for inflation). Credit card usage has been increasing. These are all signs of a consumption spree that is very long in the tooth. This spending would have already died without strong discounting from retailers during the holiday season.
We can quibble about sales and the strength of the consumer, but I don’t see the strength and I’ve discounted the “bank deposit” argument because it hasn’t captured the concept of “deferred payments” that I think affects many individuals.
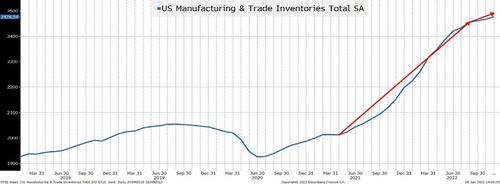
There is no debating inventories.
Business inventories are far larger than any “Covid catchup” would warrant. This is occurring as the cost of financing those inventories increases. China’s “re-opening” and shipping more “cheap” goods here is a “good” thing? Hmmmmm.
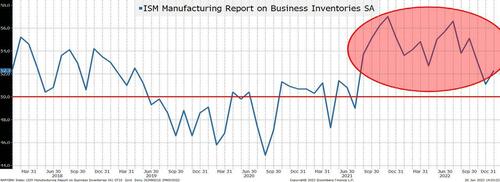
According to NAPM, inventories are increasing every month. Greater than 50 means increased inventories. There have been some big increases and while they have slowed a bit, that is from high overall inventory levels (see previous chart).
What has never fully made sense to me is why inventories are considered a “good” thing in data. NAPM and ISM treat inventory builds as positive. GDP treats inventories the same way. I can see it from this perspective, but at a time when we have big existing stockpiles and evidence that consumption is slowing (especially ex-inflation), then we are setting ourselves up for a bigger fall!
My single biggest concern is “inventory build versus consumption” and I think that this (in hindsight) will be what turns the “soft landing” chatter into real recession fears!
I am far from convinced that the Fed “will” do what the markets think it “should” do.
Good luck with the FOMC on Wednesday and I hope that you find World War v3.1 interesting when it comes out later this week.


